Kaspa is trading less than three cents, almost 87% below its 2024 record high. For Crypto Patel, that collapse is exactly what makes the current chart interesting. The analyst believes KAS ha
Kaspa is trading less than three cents, almost 87% below its 2024 record high.
For Crypto Patel, that collapse is exactly what makes the current chart interesting.
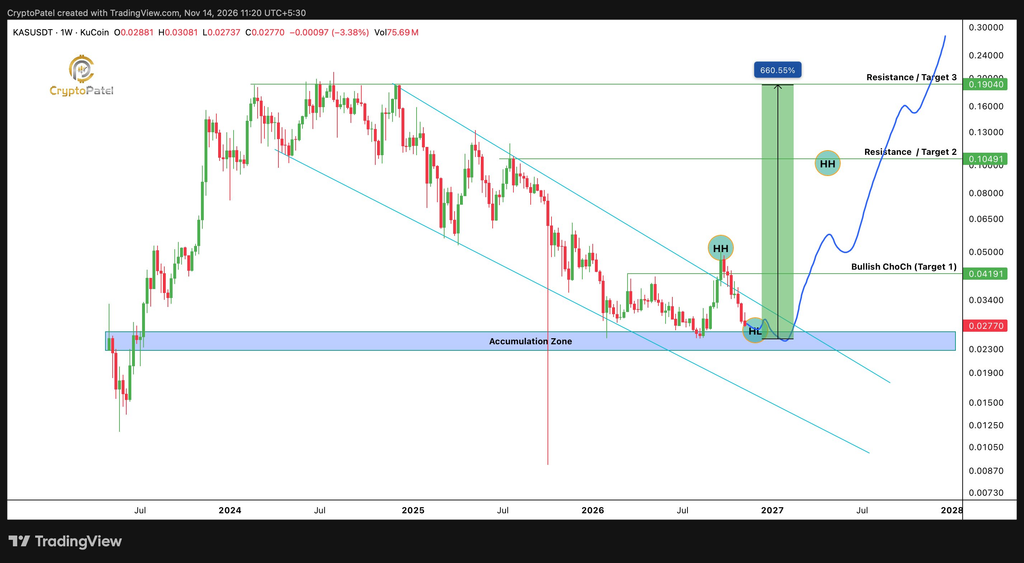
The analyst believes KAS has returned to a long-term accumulation region around $0.022-$0.027, where a higher low could eventually form. If that happens, his weekly setup maps a recovery first toward $0.0419, then $0.105 and eventually the previous cycle region around $0.19.
But there is an important catch: KAS is inside the proposed accumulation zone now, and the reversal itself has not been confirmed.
Kaspa Returns to the $0.022-$0.027 Accumulation Zone
Kaspa trades around $0.028 after touching approximately $0.0274 today. It is down more than 6% over the past week and roughly 25% over 30 days. Its August 2024 all-time high was around $0.2075.
Patel’s weekly chart places the main accumulation area between roughly $0.022 and $0.027.
That zone is important because KAS previously established a low near $0.025 before recovering above $0.04.
The analyst labels that move a bullish change of character, or CHoCH, around $0.04191. In simple terms, price temporarily broke an important previous high and interrupted the sequence of lower highs.
 Source: X/@CryptoPatel
The problem is that KAS subsequently gave the move back.
So the current test is about turning the $0.022-$0.027 region into a higher low rather than simply revisiting it on the way down.
$0.0419 Is the First Level That Changes the Picture
Patel’s first target is $0.04191.
From approximately $0.0277, reaching it would mean a gain of about 51%.
That sounds substantial, but technically it is the least ambitious part of his roadmap. Reclaiming $0.0419 would show that buyers have once again pushed KAS above the level where its previous structural change occurred.
After that, Patel marks $0.10491 as the second resistance target.
That would require approximately 279% upside from current prices.
The final marked level is $0.1904, just below the 2024 high. From $0.0277, that would represent roughly 587% upside, or nearly a 7x move.
So although Patel describes the broader opportunity as potentially 5x-10x, the actual chart shown tops out around a 7x multiple from today’s price.
Read also: Kaspa’s New Supply Is Shrinking Fast – Here’s the Math
$0.022 Is the Line That Cannot Fail
Patel’s bullish scenario comes with a clear invalidation.
He wants KAS to remain above approximately $0.022 on a higher-timeframe closing basis.
That matters because the entire setup depends on the current region producing a higher low.
A sustained loss of $0.022 would instead mean KAS has moved beneath the accumulation structure Patel is using for the thesis.
The short-term indicators are still weak. Kaspa’s daily RSI is around 30, and current technical readings continue to classify the daily structure as strongly bearish. Immediate support is near $0.0274, with resistance around $0.0289.
In other words, the macro idea may be attractive, but the market has not yet provided the confirmation Patel wants.
Kii-EnergyOS Adds an Interesting Fundamental Angle
Patel also points to Kii-EnergyOS as part of his longer-term Kaspa thesis.
The project describes itself as an energy-market operating system built around areas including energy trading and settlement, EV charging networks, storage, hydrogen infrastructure, certificates and digital identity.
Kaspa Kii says the platform will soon open for pilots involving utilities, traders, grid and storage operators, ports, fleets and fuel producers.
That is potentially interesting because it would push Kaspa into a real-world infrastructure use case rather than purely crypto-native activity.
However, these are currently project claims and planned pilots. They should not yet be treated as proven commercial adoption.
There is also more immediate ecosystem development. A decentralized order-book application running directly on Kaspa L1 recently launched its testnet, another example of applications beginning to experiment with Kaspa’s newer programmable infrastructure.
The current price makes Patel’s scenario tempting because the asymmetry is obvious.
KAS is nearly 87% below its all-time high, only around 3% of its maximum supply remains unmined, and price has returned to an area Patel already identified as long-term accumulation.
But cheap relative to an old high does not automatically mean undervalued.
For the chart to become meaningfully bullish, KAS first needs to defend $0.022-$0.027 and then recover $0.0419.
Only after that would $0.105 and $0.19 become credible higher-timeframe objectives.
Patel is essentially making a bet that the current weakness is the construction of a macro bottom rather than another pause in a long downtrend.
At $0.027-$0.028, that question is being tested right now.
For more crypto news and price predictions, click here.
Subscribe to our YouTube channel for daily crypto updates, market insights, and expert analysis.
The post Kaspa Price Setup Points to 5x+ Potential, But This Level Must Hold appeared first on CaptainAltcoin.