$LAB is drawing attention this week after going live with MoonPay onramps, letting users fund their wallet directly in the app using a debit card, with Apple Pay and Google Pay support said t
$LAB is drawing attention this week after going live with MoonPay onramps, letting users fund their wallet directly in the app using a debit card, with Apple Pay and Google Pay support said to be coming soon.
LAB positions itself as a platform aimed at making it easier to move from fiat directly into on-chain trading.
This LAB Price Prediction looks at how this funding upgrade lines up against a chart that just broke a short-term uptrend and where the key liquidity zones sit from here. Keep reading to see how the levels stack up.
LAB price today: Market Overview
Metric
Value
Price (LAB/USD)
$0.14816
24h Change
-2.9%
24h Range
$0.1455 - $0.1689
Market Cap
$48.092M
Fully Diluted Valuation
$149.103M
24h Trading Volume
$27.006M
Circulating Supply
322.543M LAB
Total Supply
1B $LAB
Max Supply
1B $LAB
Source: Data from CoinGecko as of 24/07/2026. Figures may vary slightly across other tracking websites.
Liquidation and Volume Data
The liquidation profile on LAB has leaned heavily against longs across every timeframe.
In the last hour, $2.19K was liquidated, and all of it came from long positions, with shorts untouched at $0. Over four hours, $6.22K was wiped out, again almost entirely from longs, with only $0.15K from shorts.
Zooming out to twelve hours, total liquidations reached $134.76K, split as $118.76K in longs against $16.00K in shorts. Across the full 24-hour window, liquidations totaled $328.35K, with longs accounting for $247.57K compared to $80.78K in shorts.
This consistent long-side bias across every window suggests leveraged buyers have repeatedly been caught offside as the price pulled back from its recent $0.1689 high, rather than the move being driven by aggressive short-selling.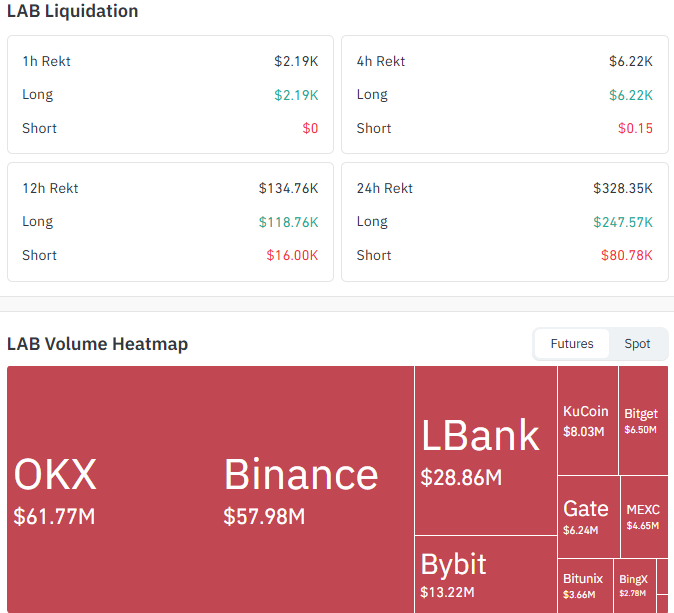
Source: Data From CoinGlass
On the volume side, futures activity is concentrated on OKX at $61.77M and Binance at $57.98M, which together dominate trading.
LBank follows at $28.86M, then Bybit at $13.22M, with KuCoin, Bitget, Gate, MEXC, Bitunix, and BingX making up smaller shares.
The heavy concentration on the two largest venues, combined with the long-liquidation bias, points to this pullback being driven mainly by leveraged long unwinds rather than organic spot selling pressure.
LAB news today: Why Is LAB Price Moving
LAB Network announced on its official X accountthat MoonPay onramps are now live, allowing users to buy crypto directly from the LAB app using a debit card.
The post added that Apple Pay and Google Pay support are coming soon, giving users more ways to get on-chain. 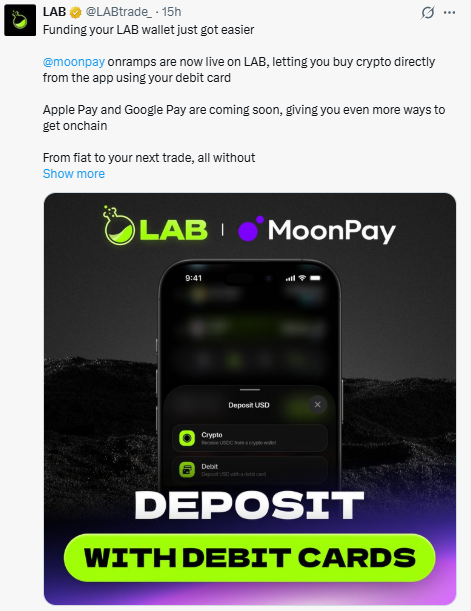
This is a funding and accessibility upgrade rather than a direct price catalyst, though smoother onramps can support future trading volume if adoption follows.
This is LAB's own announcement and has not been independently verified as having a direct price impact.
LAB forecast 2026: Chart Analysis
LAB moved through a clean falling channel from July 15 to July 21, tracking lower highs and lower lows between two descending trendlines, dropping from around $0.22 toward the $0.11266 area.
On July 21-22, the price broke out of that channel to the upside on a strong impulsive candle, then built a short-term ascending structure with a rising trendline through July 22-24.
That rising trendline has since broken down, with price rejecting near $0.153 to $0.154 below the EMA and sliding back to the current $0.14816 zone.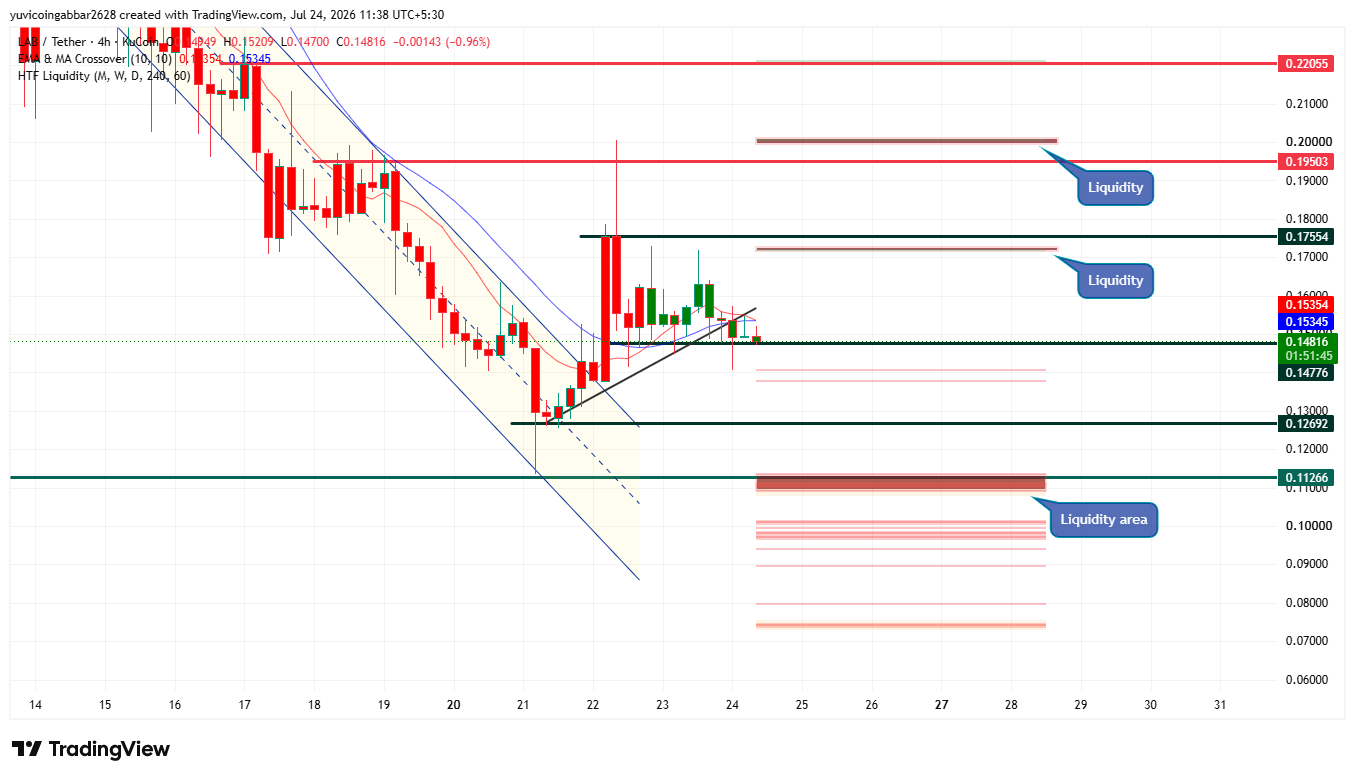
The EMA and MA crossover (10, 10) shows both averages converging around $0.15354 to $0.15345, just above the current price, indicating momentum has flattened right at the point the short-term uptrend failed.
Level
Price
Type
Upper liquidity / resistance
$0.19503
Untested resistance, well above current structure
Immediate resistance
$0.17554
First resistance, channel breakout high area
Immediate price reference
$0.14816
Just below the EMA crossover zone
Initial recovery level
$0.1535
EMA crossover zone, needed for bullish continuation
First confirmed support
$0.12692
Prior channel low
Deeper support / liquidity area
$0.11266
Origin of the channel breakout
Far resistance
$0.22055
Longer-term liquidity level, not near-term relevant
Price Scenarios
Scenario
Target
Trigger
Timeframe
Invalidation Level
Bullish
$0.17554
Reclaim of $0.1535 EMA crossover zone on rising volume
3 to 7 days
Close back below $0.12692
Base Case
$0.12692 to $0.1535
Price stays range-bound with no clear volume expansion
3 to 7 days
Daily close outside either side of the range
Bearish
$0.11266
Break below $0.12692 support with continued long liquidations
3 to 7 days
Reclaim of $0.12692 on rising volume
Two Scenarios: Bounce vs Breakdown
Bounce scenario: If LAB reclaims the $0.1535 EMA crossover zone on rising volume, the next test becomes $0.17554, the first confirmed resistance from the recent channel breakout high.
Invalidation for this view is a daily close back below $0.12692.
Breakdown scenario: If price fails to hold above $0.12692 and long liquidations continue, LAB risks sliding toward the deeper $0.11266 liquidity zone, which marks the origin of the earlier channel breakout.
Invalidation for this view is a reclaim of $0.12692 on rising volume.
Risk Note
LAB has seen the bulk of its recent liquidations come from long positions across every timeframe, meaning leveraged buyers have repeatedly been stopped out on this pullback.
With 24-hour futures volume concentrated heavily on OKX and Binance, price can move sharply if either venue sees a fresh wave of forced selling.
Treat any bounce attempt with caution until it clears the $0.1535 EMA crossover zone on real volume.
LAB market outlook: Expert View
According to CoinGabbar analysts, the chart structure and liquidation data are telling a consistent story here.
The short-term uptrend that formed after the falling channel breakout has failed right at the EMA crossover, and longs have been the ones absorbing the pain across every time frame.
The MoonPay onramp launch is a genuine accessibility upgrade, but it has not yet shown up as a shift in the liquidation bias.
Watching whether LAB can reclaim $0.1535 on rising spot volume, rather than just futures activity, will say more about a real reversal than the news alone.
Disclaimer: This article is for informational purposes only and should not be considered financial or investment advice. Cryptocurrency markets are highly volatile, and prices can change rapidly based on market conditions. Readers should conduct their own research and consult a qualified financial advisor before making any investment decisions. CoinGabbar does not guarantee the accuracy of price predictions, and past performance is not indicative of future results.