ZRO is on fire today; LayerZero just ripped higher, up big on the day, breaking out of a decline that's dragged on for months. This LayerZero Price Prediction breaks down whether the rally ha
ZRO is on fire today; LayerZero just ripped higher, up big on the day, breaking out of a decline that's dragged on for months.
This LayerZero Price Prediction breaks down whether the rally has more room to run or if it's about to cool off, and the exact levels that'll decide it.
Here's the full picture.
Market data was checked on August 22, 2026, at 09:40 IST.
LayerZero Price Prediction Today: Market Overview
Metric
Value
Price
$1.0712
24h Change
+25%
Market Cap
$393.82M
Unlocked Market Cap
$753.76M
FDV
$1.06B
24h Volume
$100.5M+
Vol/Mkt Cap (24h)
25.32%
Liquidity/Mkt Cap
0.15%
TVL
$6.96B
Market Cap/TVL
0.05684
Total Supply
1B ZRO
Max Supply
1B ZRO
Circulating Supply
369.14M+ ZRO
Holders
1M
Source: Data from CoinMarketCap as of August 22, 2026, at 09:40 IST. Figures may vary slightly across other tracking websites.
Can ZRO Become the Next Bitcoin?
Bitcoin trades at $78,696.09, up 5.03% today, with a market cap in the trillions and a fixed 21M supply that's been running for over a decade.
ZRO is a $393.82M project still building out its cross-chain infrastructure use case, with a max supply of 1B tokens.
Bitcoin's size and track record put it in a different category entirely, ZRO's story is about proving out its niche in blockchain messaging, not competing with Bitcoin's role as a store of value.
Why Is ZRO Up Today?
ZRO's jump today lines up with a broader altcoin rally, with money rotating out of Bitcoin and into altcoins as risk appetite picks up.
When alts run like this, tokens like ZRO tend to see outsized moves compared to Bitcoin's steadier climb.
No specific LayerZero news is confirmed behind the spike, so this looks like part of the wider market move rather than a one-off catalyst.
ZRO Price Prediction Chart: Technical Analysis
Pair: ZRO/USDT · Market: Spot (Crypto) · Exchange: OKX · Timeframe: 1D · Source: TradingView · Timestamp: August 22, 2026, 09:40 UTC+5:30
ZRO is trading at $1.0712, after breaking above a descending trendline that had been pressing the price lower since early to mid June.
The breakout candle cleared a long stretch of consolidation between $0.700 and $0.8950, and the price is now pushing into the zone just under the $1.1167 resistance level.
RSI sits at 75.96, well into overbought territory, meaning the move is stretched and a short-term cooldown or pullback wouldn't be unusual even if the broader trend stays bullish.
The EMA cluster sits far below the current price, acting as a longer-range floor rather than near-term resistance.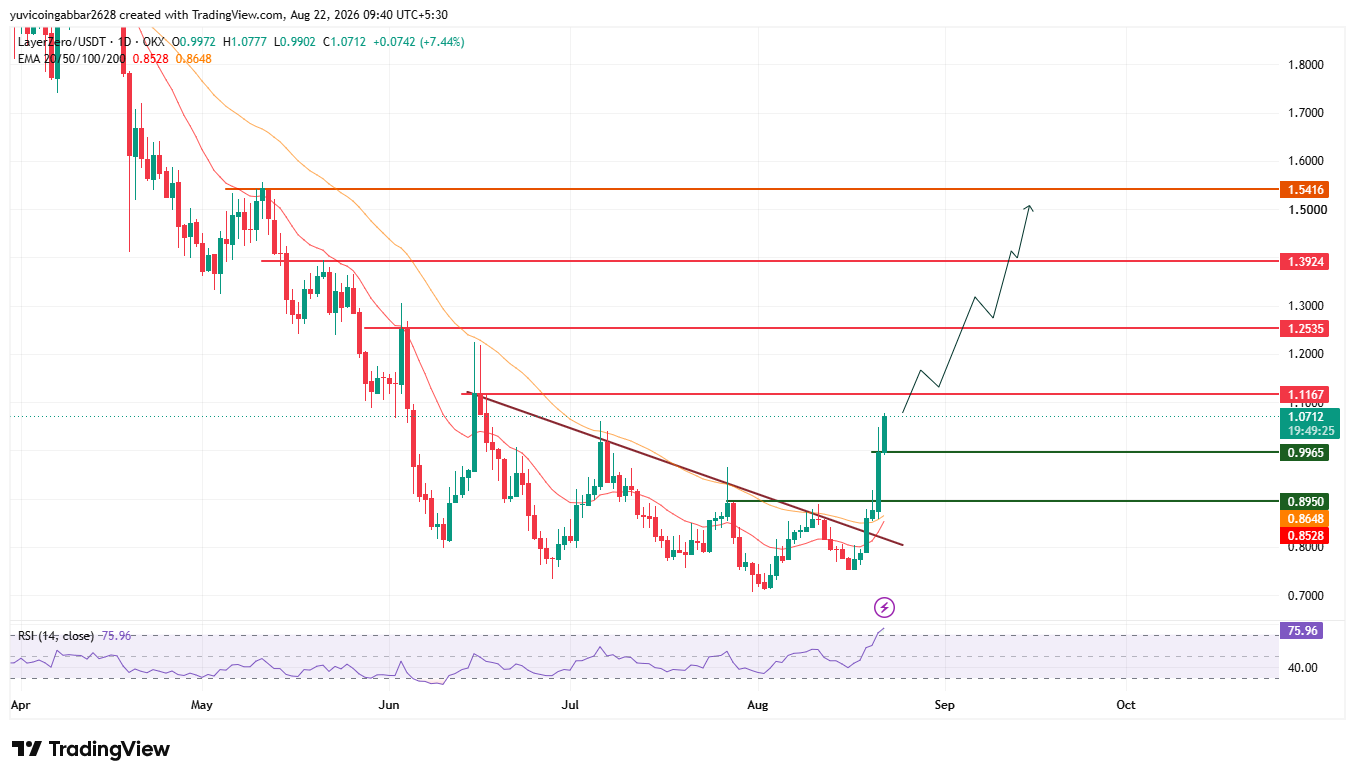
Important Key Levels
Level Type
Price
Resistance 4
$1.5416
Resistance 3
$1.3924
Resistance 2
$1.2535
Resistance 1 (nearest)
$1.1167
Immediate Price Reference
$1.0712
First Support
$0.9965
Deeper Support
$0.8950
Structural Floor (EMA zone)
0.8648–0.8528
LayerZero Forecast: Bull Case vs Bear Case
Bull case: Holding above $0.9965 keeps the trendline breakout intact.
A confirmed close above the nearest resistance at $1.1167 would open the path toward $1.2535 and then $1.3924.
Bear case: Losing $0.9965 would suggest the breakout is fading and the move was a short-term squeeze.
A deeper break below $0.8950 would put the EMA zone near 0.8528–0.8648 back in play as support.
$ZRO Price Prediction Scenarios
Scenario
Trigger
Likely Outcome
Invalidation Point
Trendline reclaim
Price holds above $0.9965
Continuation toward $1.1167
Close below $0.9965
Channel hold
Consolidation between $0.700 and $0.8950
Range-bound trade before next leg
Break outside either bound
Channel breakdown
Close below $0.8950
Retest of EMA zone near 0.8528–0.8648
Reclaim of $0.9965
Can ZRO Reach $1.5416?
$1.5416 is the highest resistance marked on the chart.
Getting there would need ZRO to clear $1.1167 first, then $1.2535 and $1.3924 in sequence, a multi-stage move rather than one continuous leg, especially with RSI already overbought at this stage.
LayerZero Price Prediction: Expert View
According to CoinGabbar analysts, The trendline break came on strong volume and a wide daily range, the kind of move that usually reflects real buying rather than a thin squeeze.
That said, RSI at 75.96 is a caution flag, moves this stretched often and cool off before continuing.
The $0.9965 to $1.1167 zone is the one to watch closely over the next few sessions.
Holding it keeps the breakout thesis alive, while a fast rejection would suggest buyers overextended.
Disclaimer: This piece is for informational purposes only and isn't financial advice. The levels and scenarios above are based on technical chart analysis and publicly available data at the time of writing, and crypto markets can move sharply within hours, so past patterns don't guarantee future outcomes. It's worth doing independent research and considering your own risk tolerance before acting on any of the levels discussed here.