Key Takeaways ZRO has moved into a $2.45-$2.60 multi-month resistance range. The range’s upper edge stopped three earlier rallies. $2.09-$2.15 is the first Fibonacci area beneath the advance.
Key Takeaways
- ZRO has moved into a $2.45-$2.60 multi-month resistance range.
- The range’s upper edge stopped three earlier rallies.
- $2.09-$2.15 is the first Fibonacci area beneath the advance.
- RSI above 75 shows strong but extended momentum.
Testing a resistance range that has held since May
ZRO traded near $2.44 after reaching about $2.48 on the daily chart. That brought it into the lower edge of the $2.45-$2.60 range, where price has encountered selling pressure before.
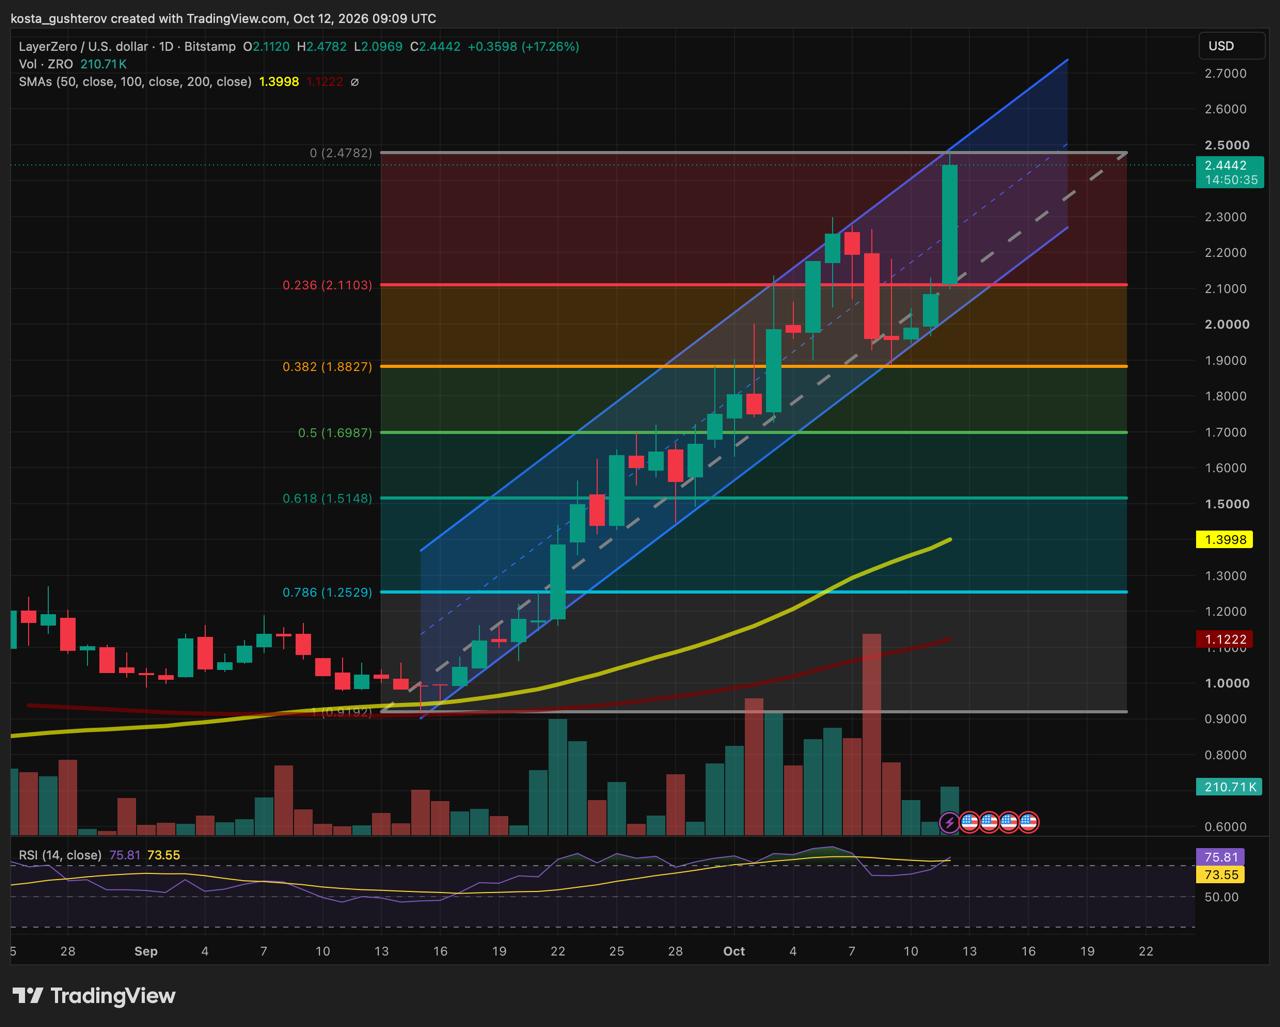
ZRO approaches channel resistance.
The shorter-term structure has improved since mid-September. ZRO has broadly moved within a rising channel, with each meaningful pullback ending above the previous one. Several wicks have crossed its boundaries during volatile sessions, but the direction remains upward while that sequence of higher lows holds.
The wider chart places the current move in a more demanding context. ZRO reached the $2.58-$2.60 area three times since May 2025 and failed to hold above it on each occasion. Buyers have therefore pushed price back to a familiar supply area, but they have not yet shown that it can become support.
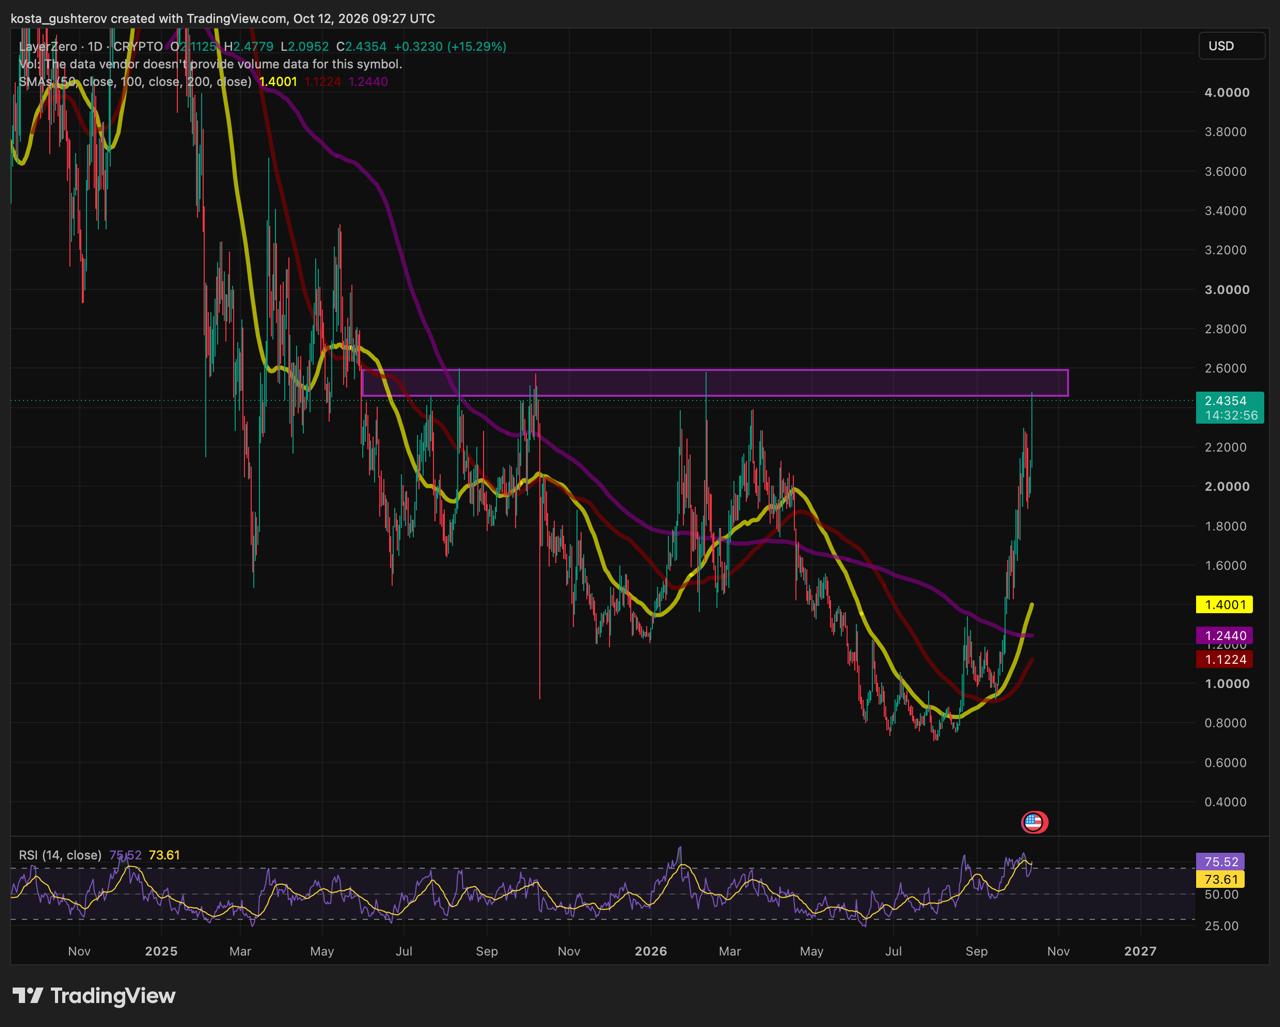
ZRO revisits multi-month resistance.
Chart source: TradingView, ZRO/USD, October 12, 2026.
Support levels show how much room the rally has
A move deeper into the range would be progress, but a close through its upper boundary and a later retest would offer a more convincing breakout signal. If sellers take control first, the Fibonacci structure identifies the areas where the September recovery could try to stabilise.
ZRO’s price map
$2.45-$2.60: The current multi-month resistance range. A close above the upper edge would change the larger setup.
$2.09-$2.15: The 0.236 Fibonacci area and the first band that needs to absorb a pullback.
$1.85-$1.90: The 0.382 Fibonacci level and an early-October reaction area. Holding it would preserve the broader recovery after a deeper retracement.
$1.67-$1.70, then $1.50-$1.52: The 0.50 and 0.618 Fibonacci areas if selling extends further.
Momentum supports the advance, while volume still needs a close
ZRO remains well above its 50-, 100- and 200-day moving averages, which form a deeper support cluster around $1.10-$1.40. That alignment supports the medium-term recovery, although those averages sit too far below price to decide whether the present move can hold over the next few sessions.
Daily RSI stood above 75 and remained above its smoothing line. The reading reflects the force of the rally, while also showing that price has advanced quickly into a difficult area. RSI can remain elevated during a strong trend, so the response at resistance carries more weight than the indicator alone.
Trading activity has increased during the recovery. The latest daily volume bar was still developing, however, meaning it cannot yet confirm broad participation in a sustained breakout. A completed close near the top of the range with firm volume would carry more weight than an intraday push.
Buybacks provide a separate backdrop for ZRO demand
The chart sets the immediate decision, while LayerZero’s token economics offer a separate perspective on longer-term demand. The LayerZero Foundation’s buyback dashboard lists Stargate revenue-funded purchases as active, with about 2.54 million ZRO acquired at a cumulative reported cost basis of roughly $3.68 million.
The dashboard records 162,433 ZRO purchased in September. Those purchases show that part of Stargate’s revenue has been directed toward ZRO, but they cannot establish why the token rose on a particular day. Token unlocks and holder sales can still outweigh buyback demand, while LayerZero’s separate protocol fee switch remains inactive.
LayerZero is also developing financial-market infrastructure, including ATLAS. Our earlier look at LayerZero’s Anchorage connection and ATLAS plans explains how those products could broaden the network’s use cases. Their effect on ZRO will depend on adoption and fee generation rather than product announcements alone.
READ MORE:
 XRPL Ranks 6th for Tokenized Asset Value – What the Number Misses
The close will show how far the rally has progressed
ZRO has reached the lower edge of a range that contained several earlier advances. A sustained move above the range would give the rally a stronger foundation, while a retreat that holds $2.09-$2.15 would still leave the September uptrend in place. Losing that first band would shift attention toward the deeper Fibonacci zones.
This article is for informational purposes only and does not constitute investment or trading advice. Technical levels are approximate and do not guarantee future price movements.
The post LayerZero Price Reaches $2.48, Faces Zone That Stopped It Many Times appeared first on Coindoo.