Key Takeaways ZRO trades at $1.88, up 9.15% today. Price is pressing the 0.382 level near $1.89. Late-October wick near $1.42 pierced the 0.618. Today’s low at $1.68 briefly broke the 0.5. As
Key Takeaways
- ZRO trades at $1.88, up 9.15% today.
- Price is pressing the 0.382 level near $1.89.
- Late-October wick near $1.42 pierced the 0.618.
- Today’s low at $1.68 briefly broke the 0.5.
As of 17:22 UTC on November 3, ZRO trades at $1.88 on the Binance daily chart after opening the session at $1.73. The day has ranged from $1.68 to $1.92 on about 3.7 million ZRO in volume, with the daily candle still several hours from its close.
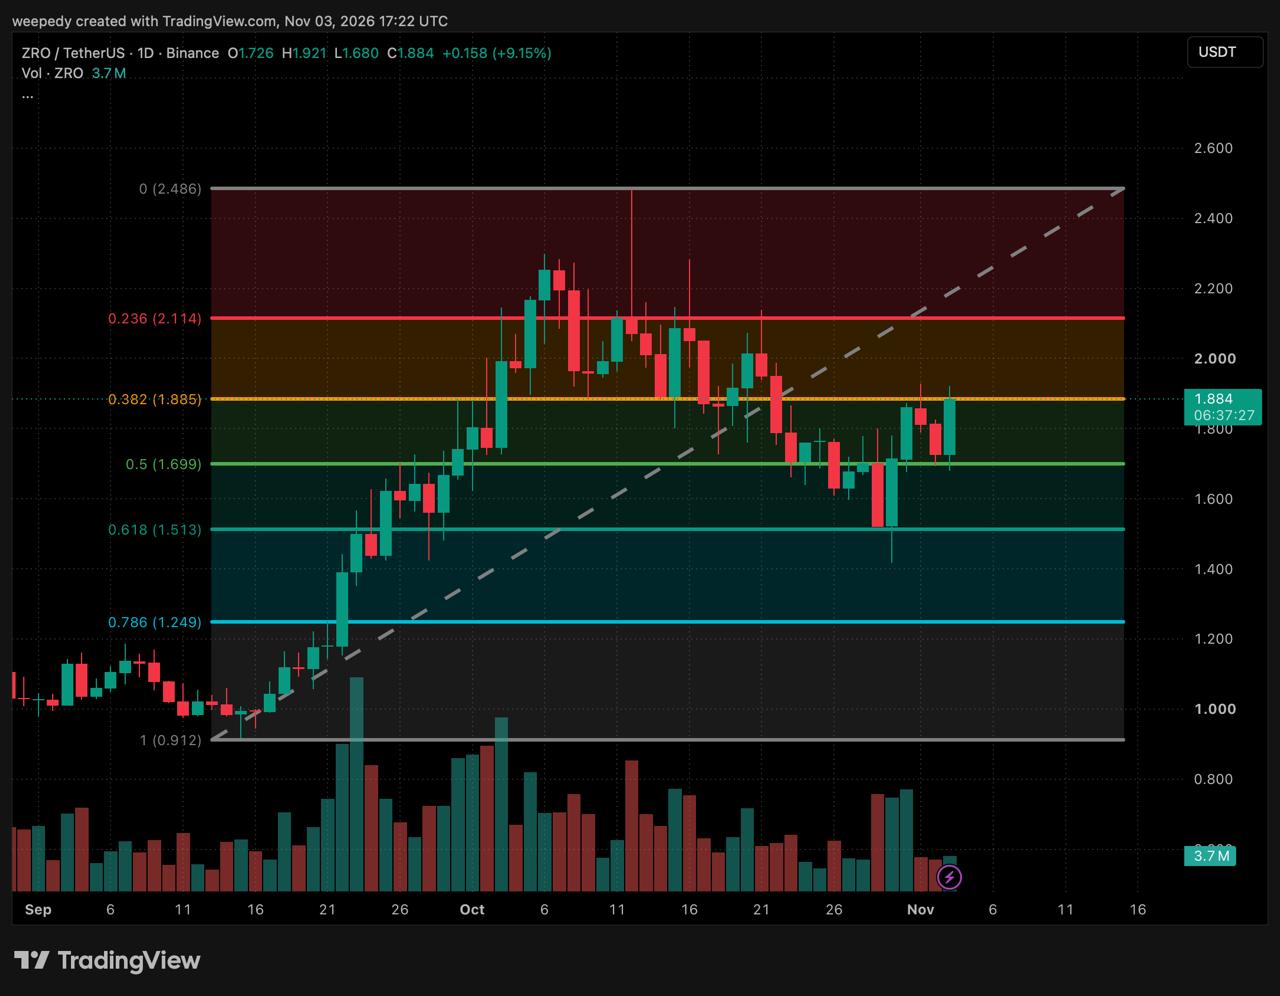
LayerZero daily ZRO/USDT technical analysis chart for November 3 / Source: TradingView
The rally behind every level
The Fibonacci grid on the daily chart spans ZRO’s September run, from a base near $0.91 on September 15 to a spike near $2.49 on October 12. That move added about 173% in less than a month, and the retracement levels drawn across it mark where the October pullback has turned.
PriceLevelRole
Near $2.490.000 FibResistance
Near $2.110.236 FibResistance
$1.92-$1.93Recent highsResistance
Near $1.890.382 FibTesting
$1.88Price nowCurrent
Near $1.700.5 FibSupport
Near $1.510.618 FibSupport
Near $1.42Oct. 30 wick lowSupport
Near $1.250.786 FibSupport
Near $0.911.000 FibSupport
The peak itself was a single wick. After the first week of October, daily closes stayed mostly below the 0.236 level near $2.11, and every push above it, including the October 12 spike, faded before the close.
Where the pullback stopped
The range broke on October 22, when a large red daily candle cut through the 0.382 level near $1.89. For the next week, ZRO churned around the 0.5 level near $1.70, with daily bodies spread on both sides of it.
The decisive candles came on October 29 and 30. The first dropped into the 0.618 level near $1.51. The second wicked down close to $1.42, below that level, before buyers took over and closed the day back above the 0.5 level near $1.70. Those two sessions and the one that followed printed the tallest volume bars of the past two weeks. A wick through a deep retracement that closes back above it fits a liquidity sweep, with stops cleared beneath support before demand returned.
Two stalls in the low $1.90s
The rebound reached the upper $1.80s on October 31, then stalled. On November 1, a push to around $1.93 was sold back into a red close, and November 2 extended the dip to a $1.73 close.
Today’s candle started by dipping to $1.68, briefly below the 0.5 level near $1.70, then reversed into a rally that topped at $1.92. That makes two highs in the low $1.90s within three sessions, both short of the area around $1.95, which marks the halfway point of the drop from the October peak near $2.49 to the wick near $1.42.
Underneath, the structure is holding. Today’s low still sits well above the October 30 wick, and the November 1-2 pullback printed smaller volume bars than the flush, which suggests sellers lacked follow-through on the way down.
Why the 0.5-0.382 corridor decides the trend
The band between the 0.5 level near $1.70 and the 0.382 level near $1.89 spans about 11%, and ZRO has spent most of the past two weeks inside it. Every daily close since October 30 has held above the lower edge. The upper edge is the level the October 22 breakdown went through, so a daily close above it would be the first since October 21 and would put the level that broke the range back beneath the price.
ZRO still trades about 24% below its October peak, though, and the two stalls in the low $1.90s show sellers waiting just overhead. Today’s candle is also unfinished: a close back near the open would leave a long upper wick at the 0.382 level and turn the rally into another rejection. The October 30 sweep only counts as a bear trap once ZRO closes above the 0.382 level near $1.89 and then clears the area around $1.95.
Both paths start at the 0.382 level near $1.89, and each depends on where the daily candles close.
If the daily close clears the 0.382
A close above the level near $1.89 would bring the November 1 high around $1.93 and the halfway point of the October drop near $1.95 into play, followed by the psychological $2.00 mark.
Clearing that cluster would open the way toward the 0.236 level near $2.11, about 12% above the current price. Beyond it, the October 12 wick near $2.49 is the only marked level left.
If the 0.382 turns sellers back
A rejection would leave today’s candle with a long upper wick and shift attention back to the 0.5 level near $1.70.
A daily close below that level, and below today’s $1.68 low, would undo the October 30 recovery and reopen the 0.618 level near $1.51 and the wick low near $1.42.
What the bounce has and has not repaired: ZRO has won back the late-October damage, but at $1.88 it still holds only about 62% of its September gain, and the daily candle behind these levels had several hours left to run at 17:22 UTC.
The post LayerZero Price Rebound Hits the Line Where It All Broke appeared first on Coindoo.