LINK has broken above a prolonged descending trendline, while stronger volume supports the move toward the $10 resistance zone. A sustained move above $9.70 could strengthen the recovery stru
- LINK has broken above a prolonged descending trendline, while stronger volume supports the move toward the $10 resistance zone.
- A sustained move above $9.70 could strengthen the recovery structure, while rejection may return the token toward lower support levels.
- Chainlink’s expanding role across DeFi, TradFi, and tokenized assets provides broader utility behind the current market recovery.
LINK is breaking beyond a months-long descending structure as buyers push momentum toward $10 resistance after prolonged consolidation in recent trading.
Breakout Gains Traction
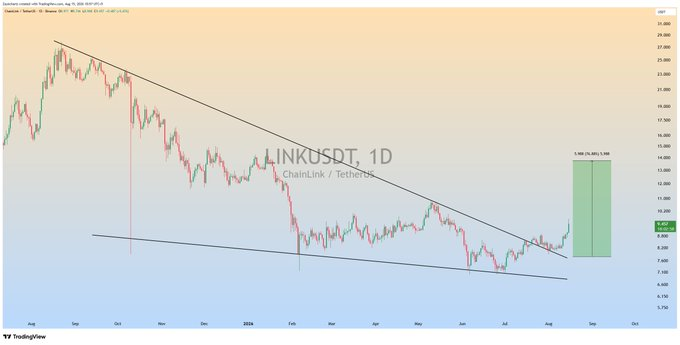
ZAYK Charts reported that LINK had reached 16% profit following the breakout. The update followed months of lower highs beneath a descending resistance line. That move shifts the setup from a breakout watch toward an active advance.
Source:
XThe daily structure shows the token trading inside a broad descending channel. Repeated rallies failed beneath falling resistance, while support contained deeper declines. Recent candles have now moved above that long-standing barrier.
The breakout area sits near the upper edge of the former channel. Holding above this level would keep the new bullish structure intact. A return below resistance would weaken the current continuation setup.
The chart projects a possible move toward the $15 region. That target represents roughly 100% upside from the displayed breakout area. However, price must maintain momentum before that projection becomes relevant.
Momentum Builds Near $10
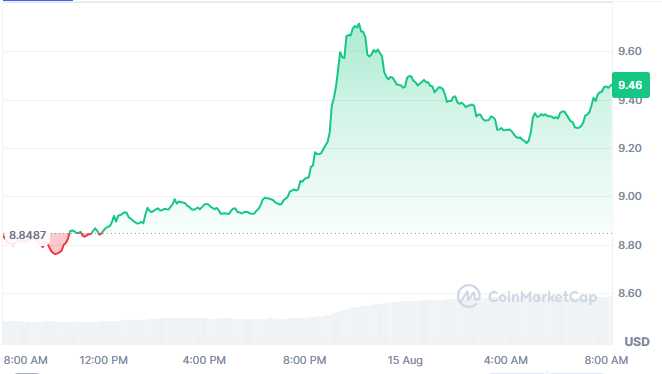
The asset reached $9.44, gaining 6.61% over the latest 24 hours. The session began near $8.82 before buyers steadily regained control. Momentum later accelerated sharply toward the $9.60-$9.70 region.
Source:
CoinmarketcapPrice then retreated toward $9.20 before recovering near $9.44. That rebound shows buyers remained active after the initial surge. Still, sellers continue defending the higher resistance band.

The $9.60-$9.70 zone now provides the nearest technical test. A decisive move above that area could place $10 within reach. Conversely, repeated rejection could keep the recovery within consolidation.
Trading volume reached roughly $498 million during the latest 24-hour period. That represents stronger participation alongside the advancing market price. Rising activity gives the breakout greater confirmation than a quiet rally.
Chainlink Utility Supports the Structure
The ecosystem map shows Chainlink serving several blockchain market segments. DeFi uses its oracle services for reliable pricing and settlement data. TradFi and tokenized assets extend that utility beyond decentralized markets.
The network also connects AI, infrastructure, GameFi, NFTs, and crypto applications. These sectors require external data, automation, or cross-chain functionality. That broad usage supports the infrastructure case surrounding the token.
Coin0va described the asset as an established infrastructure token within crypto. The commentary noted that integrations and adoption can influence longer-term demand. That framework differs from smaller tokens driven mainly by short-lived narratives.
Market data places its capitalization near $7.06 billion currently. Circulating supply stands near 748.09 million tokens, with one billion maximum. The next phase depends on holding breakout levels while testing higher resistance.