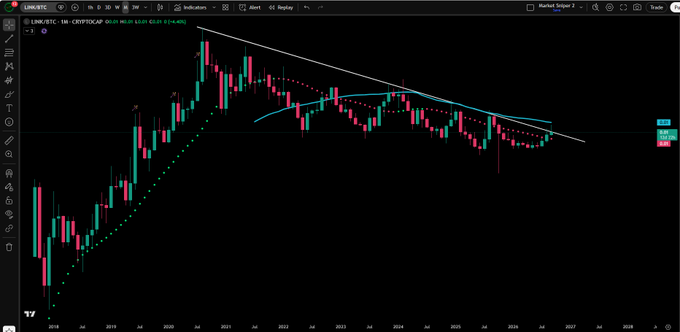
LINK/BTC is nearing a six-year descending trendline, with the monthly structure showing early signs of a potential momentum shift. Three-week momentum has turned bullish, while the monthly ch
- LINK/BTC is nearing a six-year descending trendline, with the monthly structure showing early signs of a potential momentum shift.
- Three-week momentum has turned bullish, while the monthly chart still requires confirmation above its established long-term resistance.
- Derivatives remain long-heavy as open interest rises, but recent liquidations show bullish positions facing notable short-term pressure.
LINK is nearing a pivotal relative-market test as prolonged weakness against Bitcoin shows signs of easing. The monthly structure now approaches a major resistance boundary for relative market leadership.
Six-year relative decline reaches resistance
Chainlink as of the time of writing trades at $11.82, up 5.78% over 24 hours, while derivatives remain heavily long-biased. The setup combines improving momentum with elevated liquidation sensitivity.
The monthly LINK/BTC structure reflects years of weaker performance against Bitcoin. After peaking during 2020, the pair formed a prolonged sequence of lower highs. A descending trendline repeatedly contained recoveries across the following years.
Recent candles show the pair advancing toward that long-term resistance. Price has compressed beneath the trendline after recovering from lower levels. This creates a closely watched technical test for the monthly timeframe.
Jesse Olson described the developing structure as a possible reversal. His post notes that Bitcoin dominated the pair for roughly six years. He also stated that the three-week chart has already turned bullish.
Source:
X
The monthly structure has not confirmed that transition yet. A sustained close above resistance would provide clearer evidence of changing relative momentum. Until then, the established descending structure remains technically relevant.
Momentum indicators show a developing shift
The chart's cyan moving average provides another reference for the recent recovery. The pair spent extended periods beneath this average during its broader decline. Recent candles have moved closer as relative performance improves.

The Parabolic SAR also shows a recent change in positioning. Its dots have shifted beneath price during the latest advance. That configuration reflects improving momentum compared with earlier bearish periods.
The three-week bullish reading adds shorter-term confirmation to the developing monthly setup. However, the larger timeframe still requires a confirmed breakout above resistance. The two signals therefore describe different stages of the same structure.
Current price action remains close to the long-term descending boundary. A rejection would leave the broader downtrend structure intact. A confirmed breakout would instead establish a new technical condition.
Derivatives positioning adds leverage sensitivity
The derivatives dashboard shows open interest rising 7.36% to $620.90 million. Meanwhile, derivatives volume declined 4.35% to $435.42 million. This divergence indicates greater outstanding exposure despite softer trading activity.

Source:
Coinglass
Long positioning remains dominant across the reported major exchange ratios. Binance records a 1.4956 long-short account ratio for LINK/USDT. OKX shows 1.94, while top-trader position ratios reach 2.1972.
Liquidations reveal recent pressure on bullish positions despite that positioning. Four-hour liquidations reached $290.38K, with $259.22K coming from longs. Twenty-four-hour liquidations approached $987.80K, with longs accounting for $912.56K.
The market combines bullish positioning with elevated liquidation exposure. A sustained upside move could pressure remaining shorts and reinforce momentum. However, renewed weakness could expose crowded longs to further forced selling.