LINK has stayed within the 7.63–9.498 support range and the latest price action has not yet signalled a new low for traders. The four-hour Elliott Wave count allows wave five of wave (C) to e
- LINK has stayed within the 7.63–9.498 support range and the latest price action has not yet signalled a new low for traders.
- The four-hour Elliott Wave count allows wave five of wave (C) to extend lower toward deeper Fibonacci retracement levels for LINK.
- Funding stayed positive for 88% of the period, although recent negative readings point to a change in derivatives positioning for LINK.
LINK is in the process of testing a wide Fibonacci support zone, but there are mixed signals in the derivatives data as well as recent trading activity for market participants across the market.
LINK Faces Several Fibonacci Support Levels
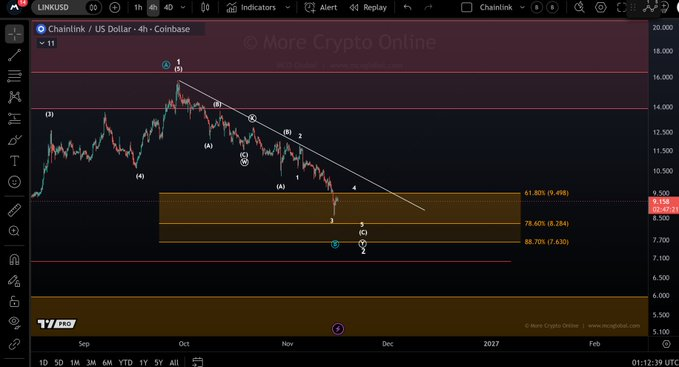
More Crypto Online identifies an orange support region between $9.498 and $7.630. The analyst reports that LINK has entered this zone without confirming a lasting low. Wave five of wave (C) can still extend lower within this region.
Source:
X
The top line is at $9.498, which is the 61.8% Fibonacci retracement. Underneath, the 78.6% retracement is at $8.784. The bottom level is at the 88.7% retracement around $7.630.
There are separate reference levels in these levels during the continuous downward movement. The next retracement would be when prices dropped back to $8.784. Below $7.630, there is the potential to show more weakness.
LINK had rallied to the $16 level in the previous upward trend during September. The recovery was preceded by a $8 advance. The buyers eventually slowed down around the September peak and sellers took the initiative.
Elliott Wave Structure Allows Further Downside
The four hour chart shows the wave (A), (B) and (C) of the larger correction. This formation came about because of the peak in the September advance. The drop that occurred at present is part of the last segment of wave (C).
The lower number of waves indicates that a fifth wave is forming. The lower levels are already set with lower prices from previous down moves. But there is still some downsliding needed in the last subdivision.
There is also a descending white trendline that can give another clue about the present structure. It is a line that links downwards declining recovery points from the latest price action. LINK remains below this level, so that the downward formation continues to exist.
The $9.498 mark is the first significant mark for a recovery. Any action that breaks above it would be a positive technical development. For now, the lower Fibonacci levels keep their significance for the correction.
Funding Rates and Recent Price Action
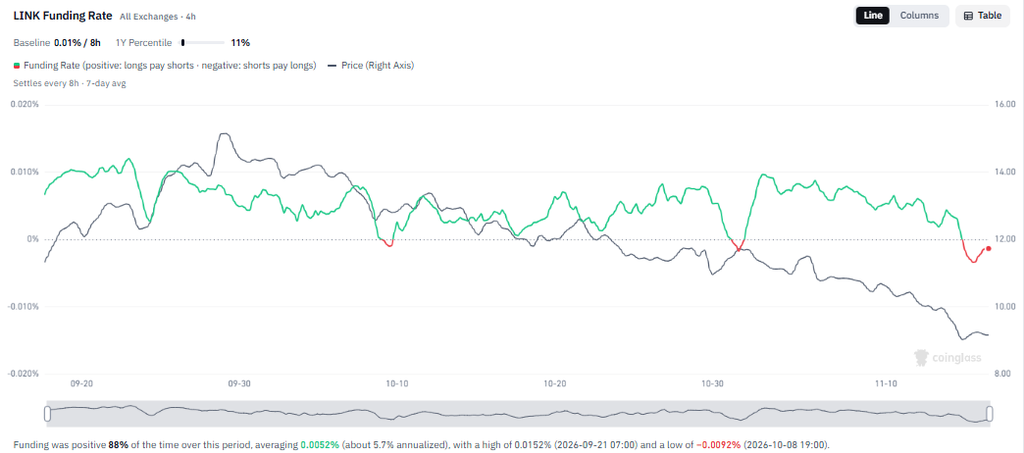
Derivatives data provides another view of LINK's prolonged downward movement. Funding remained positive 88% of the time across the displayed period. The average reading reached 0.0052%, showing predominantly positive long positioning.
Source:
Coinglass
The funding rate reached 0.0152% on September 21. It later recorded its lowest reading of -0.0092% on October 8. The indicator has also moved below zero near the latest chart reading.
In the interim, the price of LINK began to rise towards 15 during late September. The blue line then began to move in a long downward trend. Despite the majority of positive funding, it dropped towards the 9 regions by November.
LINK is testing its $9.06 range on the 24-hour chart and is recovering toward $9.29. The token rose sharply in value as buyers started to intervene. But the volume of trading that was shown was 56.17% lower.
This recovery brings LINK to the top end of the 'recent trading range'. The funding shift is indicative of shifting conditions in derivatives markets. The two developments do not indicate a broader correction is complete.
The short-term picture is still receding upwards from the 9.498 level towards the 7.630 mark. Wave five of wave (C) may continue to extend towards lower retracement levels. The provided chart structure does not include a confirmed reversal.