Litecoin trades near a major accumulation zone after months of price weakness and declining market confidence. Long liquidations exceeded $10 million during key selloffs, removing leveraged b
- Litecoin trades near a major accumulation zone after months of price weakness and declining market confidence.
- Long liquidations exceeded $10 million during key selloffs, removing leveraged bullish positions from futures markets.
- Traders continue monitoring whether LTC can defend support and rebuild momentum above recent lows.
Litecoin Accumulation Zone remains a focal point for traders as LTC stabilizes after heavy liquidations. Market participants continue assessing long-term support levels while monitoring whether recent deleveraging can support a stronger recovery structure.
Long-Term Structure Keeps Traders Focused on Support
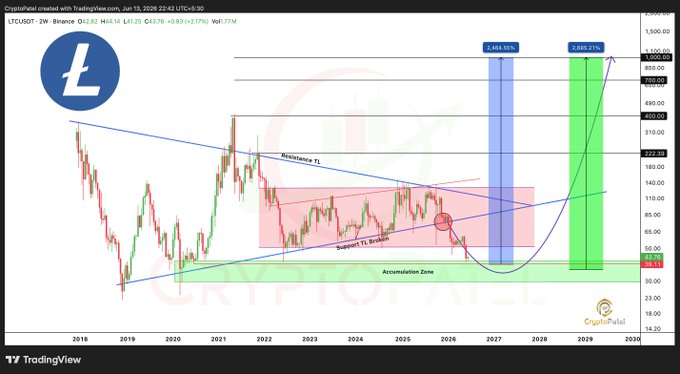
A social media post from analyst CryptoPatel renewed attention around Litecoin's market structure. The discussion centered on a projected recovery following years of underperformance. Market participants closely examined long-term support levels on the chart.
Source:
XThe analysis identified a key accumulation area between $30 and $41. This region sits near historical support established across previous market cycles. Buyers often monitor such zones during prolonged periods of weakness.
The chart also showed a descending macro resistance trendline. Litecoin has traded below that barrier since the 2021 cycle peak. Repeated rejections limited sustained upside momentum across multiple years.
As of writing,price action places LTC near the identified support region. Litecoin trades at $43.99 following recent market weakness. That level keeps attention firmly on nearby accumulation boundaries.
Liquidation Events Reshape Market Positioning
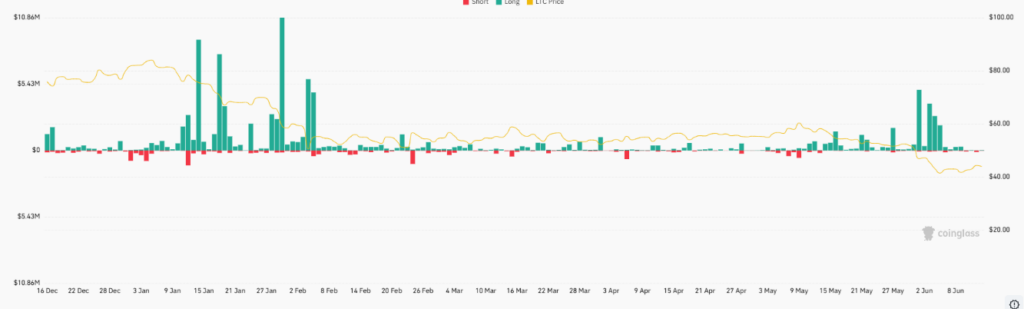
The liquidation chart revealed several notable leverage flushes during recent months. Long liquidations dominated activity across most of the displayed period. Multiple spikes reflected aggressive bullish positioning before sharp corrections.
Source:
CoinglassThe largest liquidation event exceeded $10 million during a rapid decline. Those forced closures occurred as prices moved against leveraged traders. Consequently, excessive optimism faced repeated setbacks throughout the market.

January and February produced several major liquidation clusters. During that period, Litecoin fell from roughly $80 toward lower levels. Many traders attempted early bottom entries before additional weakness emerged.
Liquidation activity moderated between March and most of May. Speculative positioning gradually decreased during that quieter period. Reduced leverage often creates a more balanced trading environment.
Market Watches Recovery Potential After Deleveraging
Another liquidation wave appeared during late May and early June. Litecoin declined from approximately $60 toward the low-$40 region. The move triggered additional forced selling across futures markets.
Despite the correction, LTC posted a 4.21% weekly gain. The asset also recorded a modest 0.33% daily increase. Trading volume reached $210.8 million during the latest session.
The broader chart outlines a possible recovery path from support. Several future resistance levels appear above current market prices. Those levels include areas near $223, $490, and higher projections.
For now, traders remain focused on support preservation. Price stability above accumulation levels remains closely monitored. Market direction may depend on whether spot demand strengthens further.