A small-cap token just did something most traders only dream about, and the chart is forcing everyone to pay attention again. Lorenzo Protocol price prediction searches spiked overnight, and
A small-cap token just did something most traders only dream about, and the chart is forcing everyone to pay attention again. Lorenzo Protocol price prediction searches spiked overnight, and nobody expected this coin to be the name lighting up trading desks this week, especially with the broader crypto market rally today still fresh in everyone's mind. There's a listing, a liquidation squeeze, and a whale sitting on more than a third of the float, all colliding at once. So where does that leave anyone thinking about getting in now?
Why This Small DeFi Token Is Suddenly Back On Every Trader's Screen
Turns out, a coin most people forgot about three months ago is now the loudest thing on the timeline. Lorenzo Protocol price prediction searches have spiked, and it's not hard to see why once you look at what's been happening on exchange order books.
A fresh listing landed. A wave of shorts got squeezed out of position. And a giveaway campaign pulled in a crowd that had never touched this ticker before.
Retail traders are chasing green candles. Whales are sitting on positions worth tens of millions. And somewhere in between, a chart pattern is either about to break out for real or roll over hard.
We've seen this movie before with other low-float listings. It doesn't always end the way the early buyers hope.
So is this a genuine breakout or a listing pump running out of gas? Keep that question in mind as we walk through the numbers.
Key Takeaways
BANK trades near $0.2527 to $0.2531 as of July 23, 2026, up roughly 85% in 24 hours.
Immediate resistance sits at $0.30251, with a higher wall at $0.45811.
Nearest support on the 4-hour chart is $0.13748, backed by $0.04789 below it.
Weekly RSI reads 88.48, deep in overbought territory. That's a warning, not a green light.
Top 100 wallets hold 99.48% of supply. Concentration this tight is a real risk factor.
24-hour liquidations hit $5.47M, with shorts taking the bigger hit at $3.45M.
Table of Contents
What's driving BANK's price today
Technical analysis: 4-hour chart
Technical analysis: weekly chart
The short squeeze, in real time
Tokenomics and whale concentration
Liquidity and exchange volume
Bull, base, and bear scenarios
Price forecast table
Key risks
Glossary
Analysis timestamp: July 23, 2026, 03:45 UTC. Chart data sourced from TradingView (BingX perpetual feed), CoinMarketCap, and BscScan. Reviewed under a standard technical-analysis methodology using EMA, RSI, and horizontal support/resistance zones on 4h and 1W timeframes.
Lorenzo Protocol Price Prediction: Where BANK Stands Right Now
BANK last traded around $0.2527 onCoinMarketCap's live BANK data and $0.25262 on the BingX perpetual feed, up about 85% over the past 24 hours. Volume over that same window came in at $276.4M, which is 144.72% of the current $193.62M market cap.
That's a lot of turnover relative to the size of the project. A vol/mkt cap ratio above 100% usually means a coin is being actively traded, not just held.
Fully diluted valuation sits at $531.55M against a $193.62M market cap. And that gap matters, because only 764.94M of the 2.1B max supply is currently circulating.
The all-time high, $0.3283, was set just two days ago on July 21, 2026. The current price sits about 24% below that peak. We're not at a new high right now. We're recovering from one.
Coin overview data (market cap, FDV, supply, volume, all-time high/low) sourced from CoinMarketCap; snapshot taken July 23, 2026, near 03:45 UTC.
Why Is $BANK Moving Today?
Here's the thing: this isn't a random pump. BANK went live for spot trading, confirmed inKuCoin's listing announcement on July 22, with a 44,000 USDT giveaway campaign tied to the listing.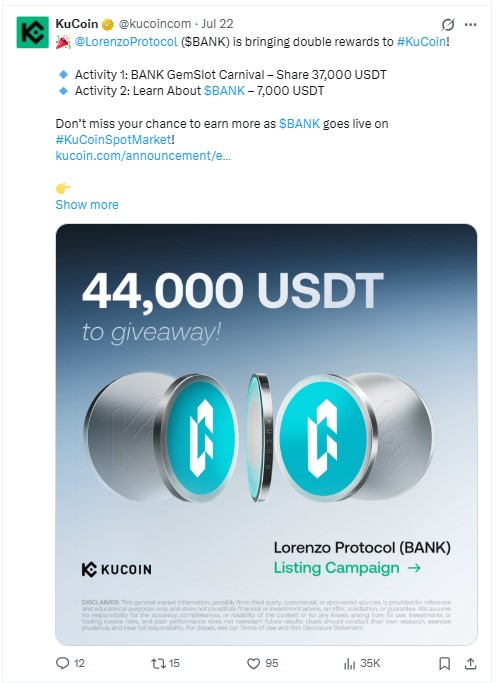
Lorenzo Protocol's own account confirmed the listing and pushed traffic toward it. New listings on major crypto exchanges routinely trigger a burst of speculative volume, and this one did exactly that.
But a listing alone doesn't explain an 85% daily move. Something else piled on top of it.
That something was a short squeeze, and we'll get to the mechanics of it shortly.
Technical Analysis: The 4-Hour Chart Tells a Bullish Short-Term Story
On the 4-hour BANK/USDT perpetual chart, viewed onTradingView's charting platform, price has been climbing inside a well-defined ascending channel since around July 15. Higher lows, higher highs, trend structure.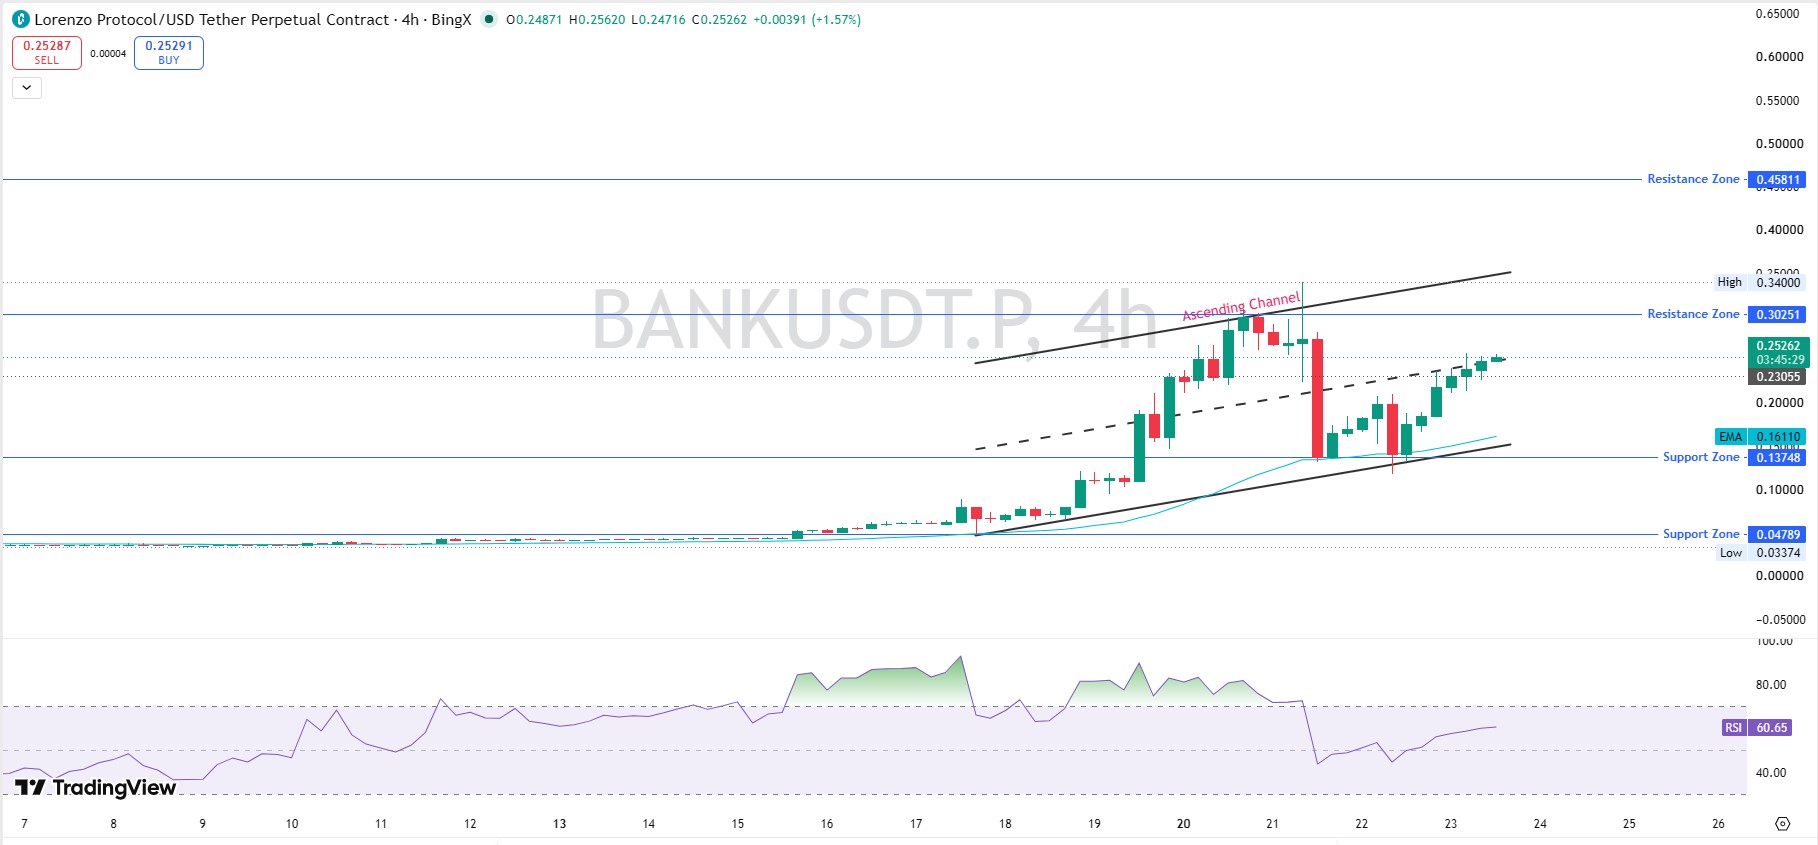
The EMA (exponential moving average, a trend line that weights recent prices more heavily than older prices) sits at $0.16110, well below the current price. That's a bullish signal on its own.
RSI (relative strength index, a momentum gauge from 0 to 100 where above 70 usually signals overbought and below 30 signals oversold) reads 60.65 on the 4-hour chart. Not stretched. There's still room to run before this timeframe looks exhausted.
Immediate resistance sits at $0.30251. A clean close above that level opens the door toward $0.45811, the next zone marked on the chart.
Support underneath sits at $0.13748, with a deeper floor at $0.04789. That lower zone would only come into play on a serious breakdown.
One thing stood out when we pulled up the candle from July 21: a sharp red wick straight through the middle of the channel, followed by an equally sharp recovery. That's not organic selling. That's a flush.
Support and Resistance Snapshot (4H)
Level TypePriceResistance 2$0.45811Resistance 1$0.30251Current Price$0.2527Support 1$0.13748Support 2$0.04789
Technical Analysis: The Weekly Chart Says Slow Down
Zoom out to the weekly timeframe, and the picture changes. RSI here reads 88.48. That's not just overbought; that's about as stretched as this indicator gets.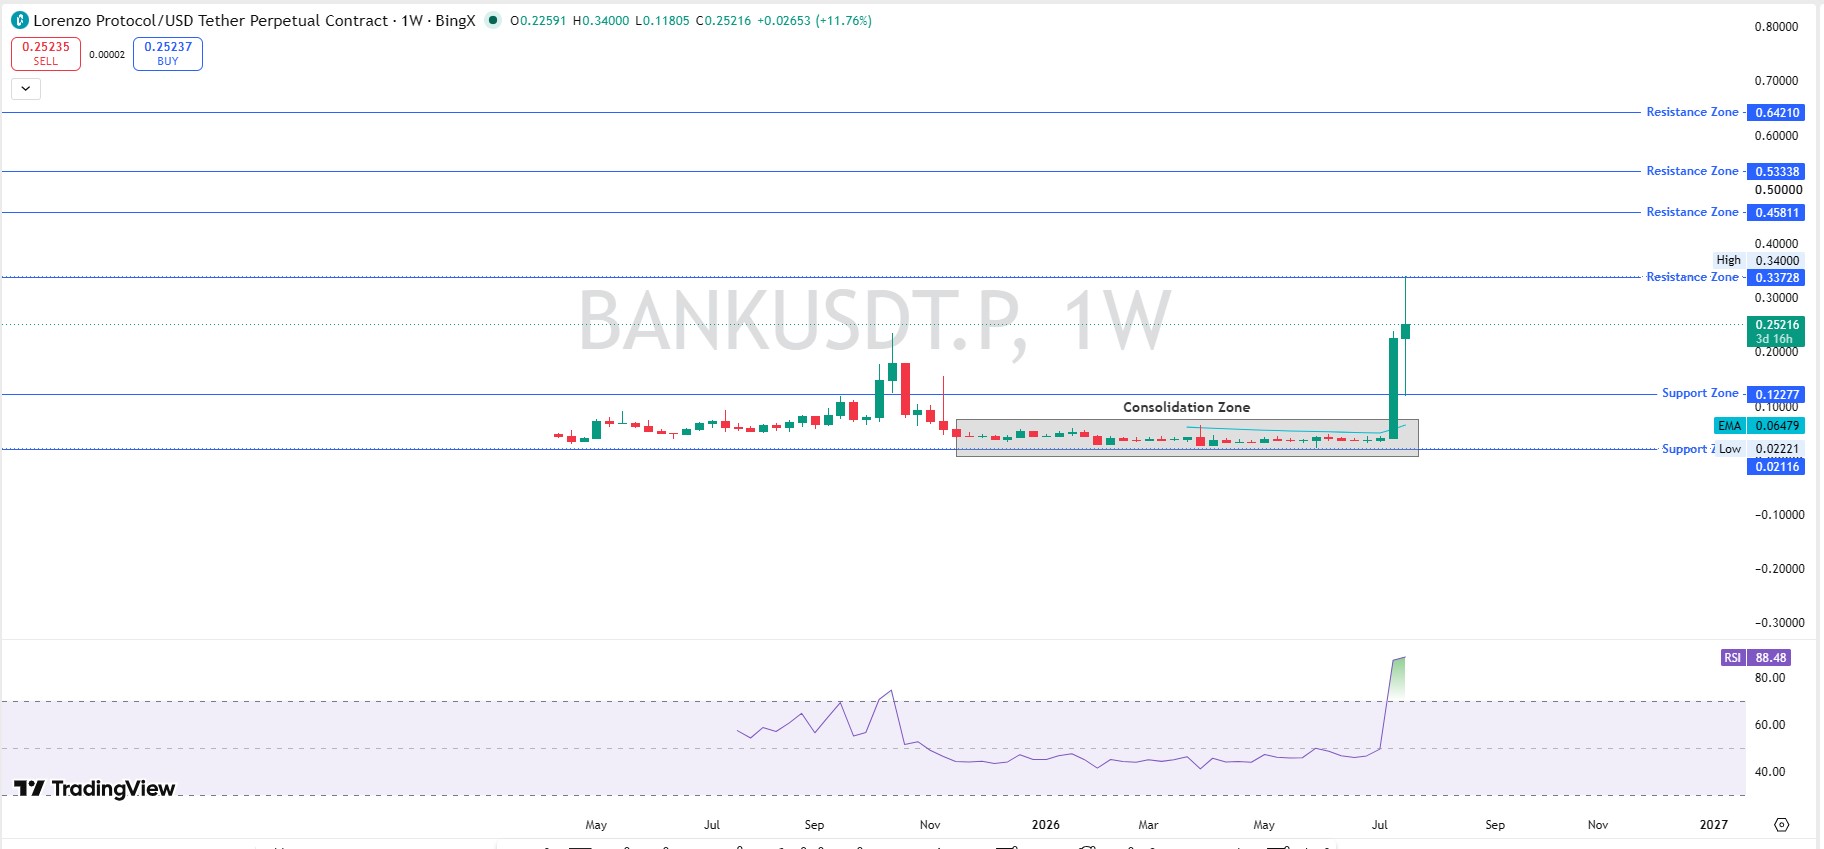
Price broke clean out of a long consolidation zone that had held between roughly $0.02 and $0.13 for months. And it did it on a single explosive weekly candle running from $0.11805 to $0.34000.
Four resistance zones stack above current price on this chart: $0.33728, $0.45811, $0.53338, and $0.64210. Each one represents a prior structural level where sellers previously showed up.
Support on the weekly chart sits far below, near $0.12277, with a deeper zone around $0.02116 to $0.02221. That's the old consolidation range, and it would take a massive reversal to get back there.
We'll be honest. A weekly RSI above 85 rarely resolves cleanly upward without at least one sharp pullback first. History acrossaltcoin market trends with low-float listings backs that up.
That doesn't mean the trend is dead. It means the next move up will likely come with more volatility, not less.
Breaking: The Short Squeeze Behind Today's Candle
Liquidation data, tracked live onCoinglass's BANK dashboard, tells a clear story. Over the past 24 hours, $5.47M in positions got wiped out.
Shorts took the bigger hit, at $3.45M. Longs lost $2.02M.
Look at the shorter windows. In the last hour alone, $67.91K in shorts got liquidated against $41.99K in longs. Over 4 hours, shorts lost $200.20K against $132.37K for longs.
The pattern repeats at every timeframe checked.
That's a squeeze. Traders bet against the rally, the price moved up anyway, and forced buybacks from margin calls added fuel to the move. This is part of why the candle looks so violent on the 4-hour chart.
Squeezes fade once the short interest clears out. When they do, momentum often cools fast, a pattern that shows up in theBitcoin price outlook just as often as it does on smaller-cap charts.
Tokenomics and Whale Concentration:
BANK's token contract, viewable throughBscScan holder data, runs on BEP-20 (BNB Smart Chain). The max total supply is capped at 1,212,195,831.998333 BANK on-chain, while CoinMarketCap lists a longer-term max supply of 2.1B, with 764.94M currently circulating.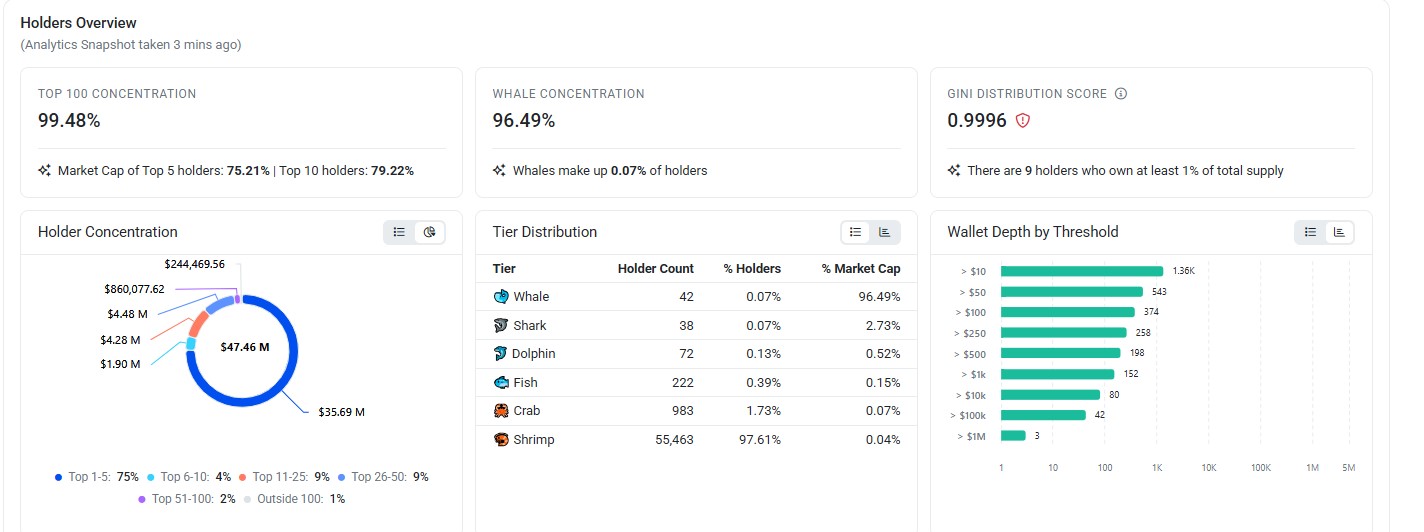
And here's where things get uncomfortable. Top 100 wallets control 99.48% of the market cap. Whale wallets, defined here as addresses holding over $100K, make up just 0.07% of all holders but 96.49% of total value.
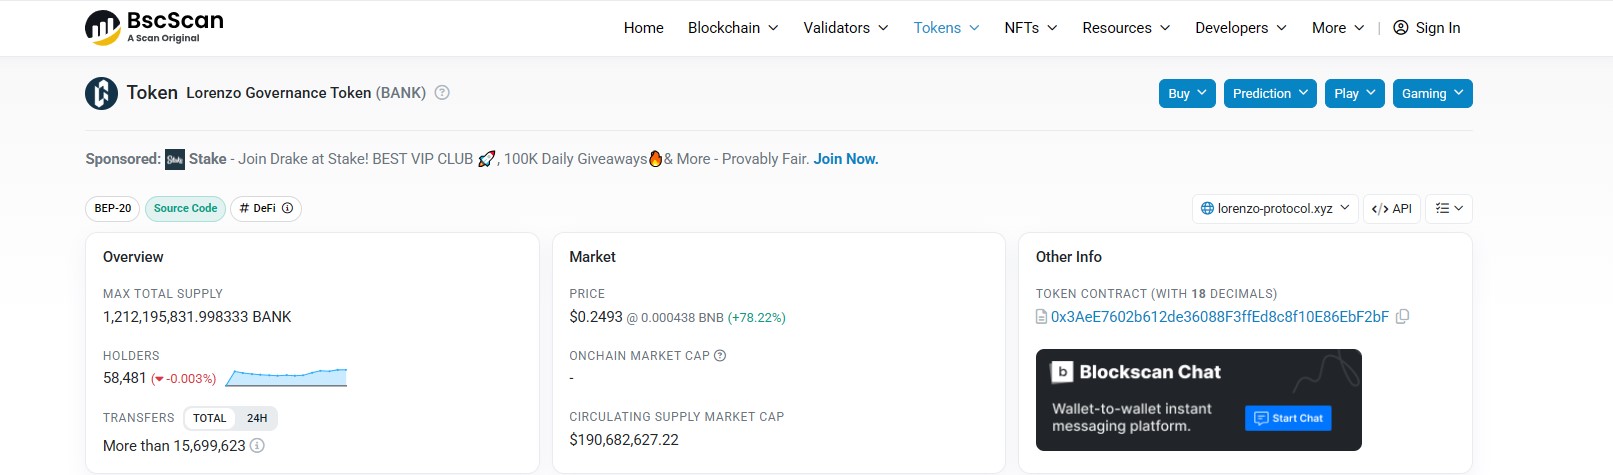
The Gini distribution score sits at 0.9996, where 1.0 represents total concentration in a single wallet. Nine holders individually control at least 1% of total supply each.
The single largest wallet, an address not tagged as an exchange, holds 36.90% of supply, worth roughly $111.5M at current prices. That's more than a third of the entire circulating float in one wallet.
Exchange wallets fill out much of the rest of the top ten. Binance Hot Wallet 20 holds 14.02%, Aster's deposit bridge holds 6.95%, Bitget holds 3.84%, and Gate holds 3.40%. Those are largely user deposits, not a single entity's directional bet, so they read differently than the top wallet does.
Holder Tier Breakdown
TierHolder Count% of Market CapWhale4296.49%Shark382.73%Dolphin720.52%Fish2220.15%Crab9830.07%Shrimp55,4630.04%
Total holder count sits at 58,481 on BscScan, essentially matching CoinMarketCap's 58.45K figure.
A single wallet controlling over a third of the supply is not a footnote. It's the risk you're accepting if you hold this token, similar in spirit to the whale accumulation flagged in the recentXRP price prediction coverage, though the scale here is far more concentrated.
Liquidity and Exchange Volume: Where the Real Trading Happens
Liquidity relative to market cap sits at just 0.07%, which is thin. Thin liquidity means larger orders can move price more than they would on a deeper market, in either direction.
Futures volume dominates BANK's trading activity right now. LBank leads with $1.81B, followed by Binance at $1.08B. Behind those two, Bybit shows $186.76M, Bitget $122.64M, MEXC $98.22M, Bitunix $62.42M, Gate $50.70M, and KuCoin around $38.70M.
That LBank figure stands out against a $193.62M market cap. When futures volume on one venue runs multiple times higher than the entire market cap, it points to heavy leveraged speculation rather than spot accumulation.
We'd treat that LBank number as a caution flag, not a confirmation signal, the same way exchange-driven volume spikes needed scrutiny in theSolana price prediction around its own listing news.
Bull, Base, and Bear Scenarios
None of this is financial advice. These are scenario-based estimates built from current chart structure, not guarantees.
Bull case: A daily close above $0.30251 opens a path toward $0.45811 within 7 to 14 days. Probability: moderate, roughly 35%, contingent on short interest staying light and no fresh token unlocks hitting the market. Invalidation: a daily close back below $0.20.
Base case: Price consolidates between $0.15 and $0.30 over the next 7 to 30 days as the squeeze unwinds and the weekly RSI cools off. Probability: highest, roughly 45%. Invalidation: a clean weekly close outside either boundary.
Bear case:Momentum fades, whale wallets begin distributing into strength, and price retraces toward the $0.13748 support zone within 30 days. Probability: roughly 20%. Invalidation: sustained volume holding above $0.25 for more than a week.
Price Forecast Table
TimeframeBearBaseBull24H$0.21$0.25$0.297D$0.16$0.24$0.3430D$0.10$0.20$0.462026 (Year-End)$0.05$0.22$0.60
These figures aren't predictions of certainty. They're ranges built around the support and resistance levels already on the chart.
Key Risks to Watch
Whale concentration tops the list. One wallet holding over a third of supply can move the market on a single decision.
Thin liquidity is next. A 0.07% liquidity-to-market-cap ratio means slippage risk on anything but small orders.
Token unlock schedules matter too, though full vesting details weren't independently confirmed in this data pull. Anyone holding this token long-term should checkLorenzo Protocol's official updates directly and browse the widercrypto price prediction hub for how similar setups have played out on other coins.
And overbought weekly RSI, at 88.48, historically precedes at least a partial cooldown. That's not a rule. It's a pattern worth respecting.
Glossary
RSI (Relative Strength Index): A 0-100 momentum indicator. Above 70 typically signals overbought; below 30 signals oversold.
EMA (Exponential Moving Average): A trend-following average that weights recent prices more heavily than older ones.
FDV (Fully Diluted Valuation):What the market cap would be if every token that will ever exist were already circulating.
Gini Score:A measure of distribution inequality, from 0 (perfectly even) to 1 (total concentration).
Liquidation:The forced closing of a leveraged position when losses exceed the trader's margin.
Funding Rate:A periodic payment between long and short traders on perpetual futures, used to keep contract prices near spot price.
Invalidation Level:The price point at which a trading thesis is considered wrong and should be abandoned.
Disclaimer: This article is for informational purposes only and does not constitute financial advice. Cryptocurrency markets are highly volatile. Always do your own research and consult a licensed financial advisor before making investment decisions.