LUMIA just ripped higher out of nowhere, and traders are asking if this move has legs or if it fades by the weekend. Why $LUMIA Traders Are Suddenly Paying Attention Lumia price prediction ch
LUMIA just ripped higher out of nowhere, and traders are asking if this move has legs or if it fades by the weekend.
Why $LUMIA Traders Are Suddenly Paying Attention
Lumia price prediction chatter picked up fast this week after the token jumped more than 28% in a single day. That kind of move gets noticed. Basically, a coin that was drifting sideways for days suddenly broke out with real volume behind it.
Turns out the breakout did not come from nowhere. Price had been coiling inside a tight range for almost a week before buyers stepped in hard.
Here's the thing: volume on the move was not small. It jumped over 300 % compared to the prior day, which tells you this was not a random wick. But is this the start of something bigger, or just a sharp bounce inside a longer downtrend?
KEY TAKEAWAYS
Direction: Short-term bullish while price holds above $0.081
Reason: Breakout from an ascending channel with strong volume
Short-term range: $0.081 to $0.109
Invalidation: A close below $0.071 flips the setup bearish
What Is Lumia Coin and Where Does It Stand Right NowMetricDataCoin NameLumiaTicker SymbolLUMIABlockchainLumia L2 (Ethereum Rollup)Today High$0.09532Today Low$0.07348RSI Level63.19Token TypeUtility and GovernanceToken CategoryRWA and DeFi Layer 2Market Cap$16.41M24H Trading Volume$27.7M24H Volume Change+323.42%Circulating Supply173.67M LUMIA24H Change+28.54%
Source: Data by CoinMarketCap
How Lumia Grew Out of the Old Orion Protocol Token
Lumia is not a brand new project. It grew out of Orion Protocol, and ORN holders swapped their tokens 1:1 into $LUMIA. The chain now positions itself alongside otheraltcoin market trends as a Layer 2 built for real-world asset trading and DeFi liquidity.
A Quick Look at Where $LUMIA Has Been Trading
LUMIA is nowhere near its all-time high of $2.60 from December 2024, sitting more than 96 % below that peak. But it's also up close to 75 % from its low of $0.05453 set back in October 2025.
Why This RWA Token Is Getting Attention Beyond the Chart
As per the source posted on X by Lumia (@BuildOnLumia), the project pointed to the Fed's latest report showing inflation near 4.1% and rates staying close to 4% by year-end, arguing that backdrop favors tokenized Treasuries and real yield products over speculative real estate plays.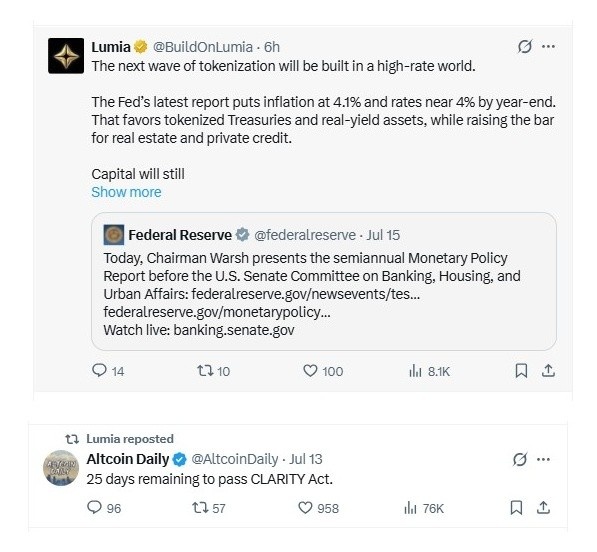
There's also a regulatory angle sitting in the background. As per the source posted on X, reposted by Lumia from Altcoin Daily, there were only 25 days remaining at the time to pass the CLARITY Act, a bill that matters a lot for how RWA tokens get treated going forward.
What Backs $LUMIA Beyond Just Price Speculation
LUMIA works as gas for the network; it powers governance through locked veLUMIA, and it secures the chain through node staking. None of that is hype dressed up as utility; it's baked into how the chain actually runs day to day.
$LUMIA Liquidation Data Shows Shorts Getting Squeezed Hard
Short sellers took the brunt of the damage as LUMIA broke out. Over the past 24 hours, $37.24K in positions got liquidated, and $28.30K of that came from shorts alone. The 4-hour window tells the same story, with $20.32K in short liquidations against just $961.20 on the long side, which lines up with how sharp that breakout candle was.
Source: Liquidation data by CoinGlass
Technical Analysis: $LUMIA Rallies 28% as Fed Rate Outlook Fuels RWA Bid
The rally did not start on the chart. It started with a macro narrative around rate stability favoring tokenized real-yield assets, and traders piled in once price confirmed it with volume.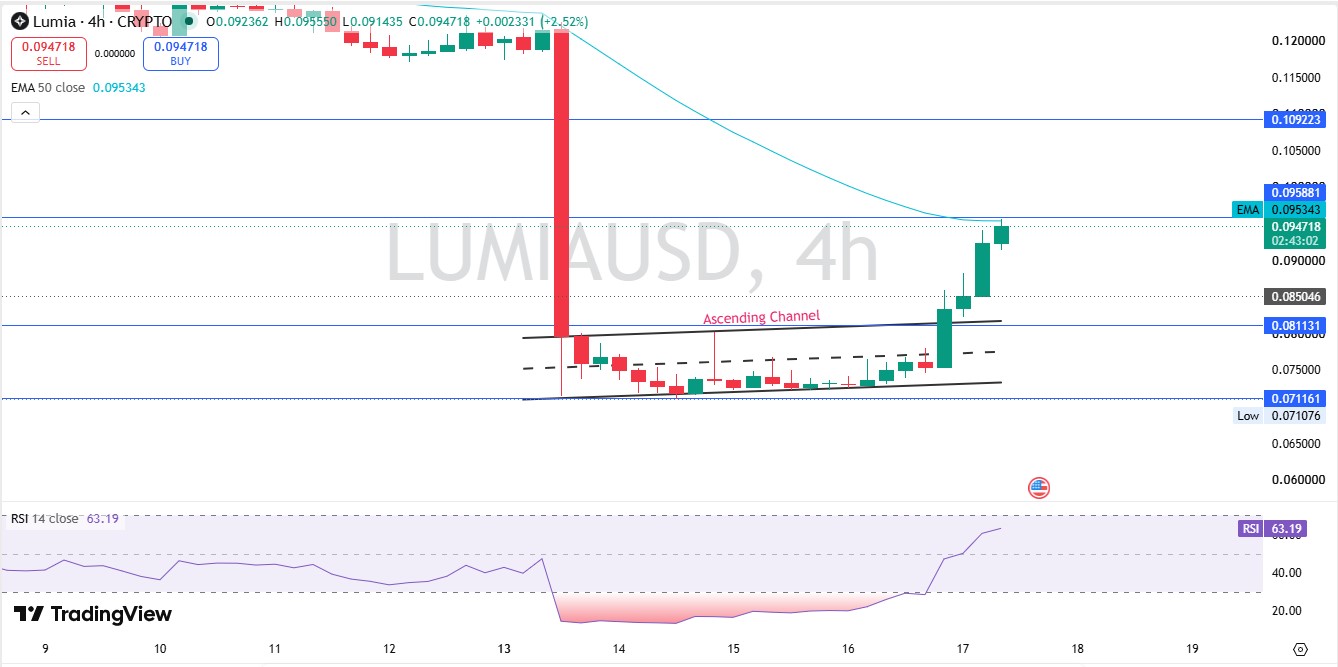
Source: Charts by TradingView
On the chart, $LUMIA broke clean above its ascending channel on the 4-hour timeframe. Price is trading above the 50 EMA at $0.095343, which keeps buyers in near-term control. RSI sits at 63.19, comfortably bullish without being overheated yet.
Support now sits at $0.081131, a level that held during the recent chop. Resistance is stacked at $0.095881 first, then $0.109223 above that. A close below $0.071161 would break the current structure and flip the read bearish. Watch for a daily close above $0.095881 on strong volume; that's the confirmation bulls need.
Where $LUMIA Volume Is Actually Coming From Right Now
As per CoinGlass, Binance is doing the heavy lifting here, with $30.99M in spot volume, well ahead of every other venue combined. Bybit sits second at $4.33M, then Bitget at $2.79M, with BingX, Bitunix, LBank, Gate, MEXC, and Aster splitting the rest in smaller pockets.
Source: Volume heatmap by CoinGlass
Short-Term Lumia Price Prediction: What the Next Few Weeks Could Bring
The near-term path depends on whether $LUMIA can hold above its breakout zone.
TimeframeBearish TargetBase TargetBullish TargetKey Trigger24 Hours$0.088$0.094$0.099Volume follow-through after breakout3-7 Days$0.081$0.096$0.109Daily close above first resistance2-4 Weeks$0.071$0.090$0.120Sustained buying above the 50 EMA
The next few sessions will decide if this was a real breakout or a fakeout.
Long-Term Lumia Price Prediction Through Next Year
Zooming out, $LUMIA's long-term case leans on whether RWA adoption actually keeps growing, much like the debate playing out in the currentBitcoin price outlook between bulls and bears.
TimeframeBearish TargetBase TargetBullish TargetCatalyst Needed3 Months$0.05$0.10$0.15Continued RWA sector inflows6 Months$0.04$0.13$0.22CLARITY Act passage and clearer RWA rulesEnd of Year$0.035$0.16$0.30Real yield product adoption on Lumia L22027 Outlook$0.03$0.20$0.45Institutional RWA volume scaling on-chain
The long-term case is not weak, but it's not guaranteed either. It leans hard on regulation actually moving.
Three Price Scenarios Traders Should Prepare For
Worst Case: The price breaks below $0.071, and the rally gets treated as a dead cat bounce.
Base Case: $LUMIA holds the channel breakout and chops between $0.081 and $0.109 for weeks.
Best Case: A clean close above $0.109 opens the door toward $0.15 and beyond fast.
ScenarioPrice RangeWhat Triggers ItWorst Case$0.05 to $0.071Breakdown below invalidation levelBase Case$0.081 to $0.109Range-bound chop near breakout zoneBest Case$0.109 to $0.15+Volume-backed close above resistanceKey LUMIA Price Levels Every Trader Is Watching
Resistance zone: $0.095881 and then $0.109223 above, both capping the current move.
Support zone: $0.081131, the floor that has held through recent pullbacks.
Invalidation zone: Below $0.071161, a close here breaks the bullish structure entirely.
Risk Factors That Could Break This Setup
Liquidity risk: LUMIA's market cap is small, so large sell orders move the price fast.
Volatility risk: A 28% daily swing shows how thin the order book still is.
Thesis breaker: A close below $0.071 or a delay to the CLARITY Act timeline.
LUMIA Analyst View and Final Thoughts on the Current Setup
When we pulled up the chart, the first thing that stood out was how clean the channel breakout looked against the volume spike behind it.
RSI at 63.19 gives room to run before anything looks stretched, and that lines up with broader sentiment on theFear and Greed Index leaning more toward greed than fear right now. And the 50 EMA sitting just above spot price means bulls still need one more push to fully confirm control.
A weekly close above $0.095881 would be the clearest signal yet that buyers are serious here, not just reacting to news.
Beyond the chart, keep an eye on the CLARITY Act timeline alongside the broadercrypto price predictions space, since regulatory clarity around RWA tokens could matter more than any single candle.
The most important level right now is $0.081131. Lose that and the whole bullish argument weakens fast.
The setup looks more constructive than most late entries into this rally are giving it credit for. Timing matters here.
Disclaimer
This article is for educational purposes only and does not constitute financial advice. Crypto markets are volatile. Consult your investment advisor before making any investment decision.