$MAGMA just ripped more than 30% higher in a day, and traders want to know if this is the start of something or another fade waiting to happen. What Today's MAGMA Move Actually Tells Us Somew
$MAGMA just ripped more than 30% higher in a day, and traders want to know if this is the start of something or another fade waiting to happen.
What Today's MAGMA Move Actually Tells Us
Somewhere between a liquidity announcement and a short squeeze, Magma Finance found its footing again. This Magma Finance price forecast looks at what pushed the token higher, where it sits on the chart right now, and what the next few weeks could realistically look like.
Trading desks have been watching $MAGMA closely since it broke out of a multi-week slide. The move wasn't random. And it wasn't quiet either.
We pulled the daily chart, the holder data, and the liquidation feed before writing a single line here. So what's actually driving this bounce, and does it have legs?
Key Takeaways
$MAGMA trades near $0.222, up roughly 30-34% over the past 24 hours after weeks inside a falling channel.
Immediate support sits near $0.154, with a deeper floor around $0.070, close to the April 2026 low.
Resistance clusters near $0.323, then $0.525, well below the $0.806 all-time high from July.
The top three wallets hold roughly 81% of the circulating supply, a concentration risk worth watching.
RSI near 47 shows the rally hasn't turned overheated yet, which leaves room to run.
Why Is Magma Finance Price Moving Today?
Magma Finance builds market infrastructure and liquidity tooling on the Sui blockchain, and its team leaned into that story hard this week. In a recentX post, the project framed itself as the liquidity layer Sui DeFi needs next, tying $MAGMA directly to Sui's growth narrative.
That kind of messaging doesn't move price alone. But paired with a sharp bounce off a multi-week low, it gave traders a reason to step back in.
Turns out, the rally lines up with a broader recovery acrossSui-based DeFi tokens this week, not an isolated pump. Short sellers got caught leaning the wrong way, and the liquidation data backs that up.
Where Is Magma Finance Price Now?
As of August 20, 2026, around 05:45 UTC, MAGMA traded at roughly $0.2246 on CoinMarketCap, up about 34% on the day. Market cap sits near $42.68 million against a fully diluted valuation of $224.67 million.
Twenty-four hour trading volume runs between $2.7 million and $6.8 million depending on the venue counted, with a volume-to-market-cap ratio near 6.2%. Liquidity against market cap sits at 3.54%, thin enough that sharp wicks aren't a surprise.
On SuiVision, the same token shows $0.2210, up 31.73%, with 17,980 holders and $1.54 million in on-chain liquidity. Small gaps between sources are normal here. Nothing alarming.
Magma Finance Technical Analysis: Chart Breakdown
On the daily chart, $MAGMA climbed from the previous session's levels toward $0.251 before pulling back to around $0.221, showing a mild cooldown after the sharp rally.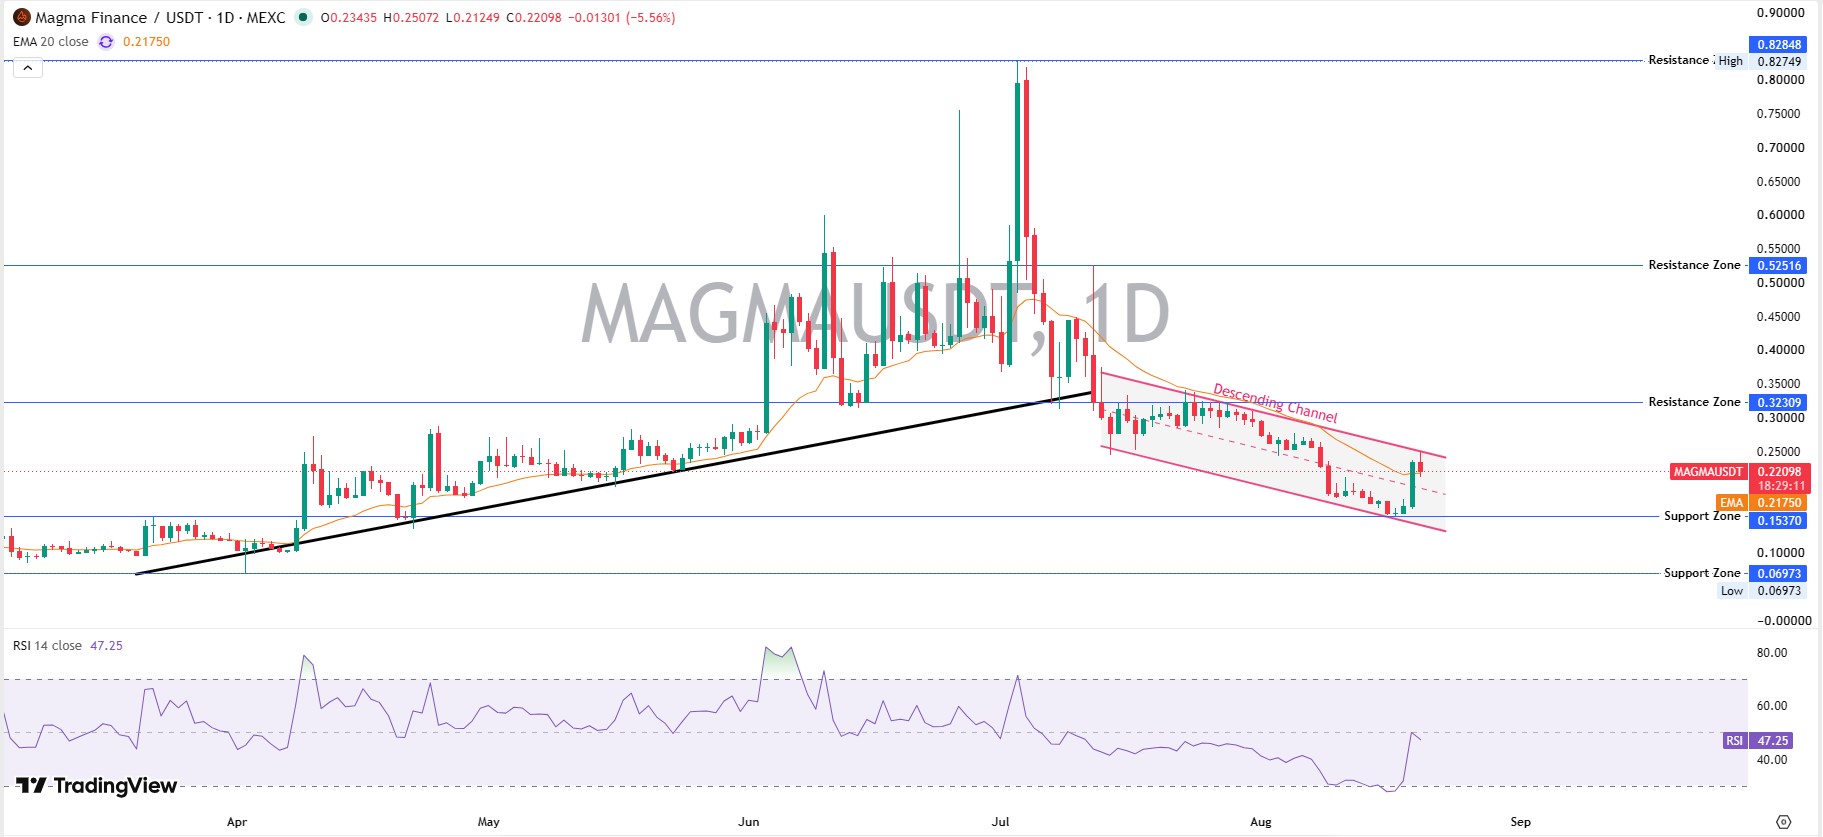
The 20-day EMA sits at $0.2175, right under current trading levels, a sign the short-term trend has flipped from bearish to neutral-leaning-bullish. RSI(14) reads 47.25. That's centered, not stretched, which matters because it means the bounce still has room before anyone can call it overbought.
Price had spent most of July and August trading lower inside a descending channel that formed after the token's early-July peak near $0.827. This week's push broke that channel's upper boundary, a structural shift worth noting.
Resistance now stacks at $0.323, then $0.525, and finally the old highs near $0.827. Support builds at $0.154, with a harder floor at $0.070, matching the April low. Aprior surge in MAGMA traded through similar zones before fading, so history says treat this level with respect, not certainty.
Magma Finance Tokenomics and Whale Concentration
$MAGMA has a 1 billion total and max supply, but only about 190 million tokens, or 19%, are circulating. The rest sits locked or unvested, a real overhang for anyone thinking long-term.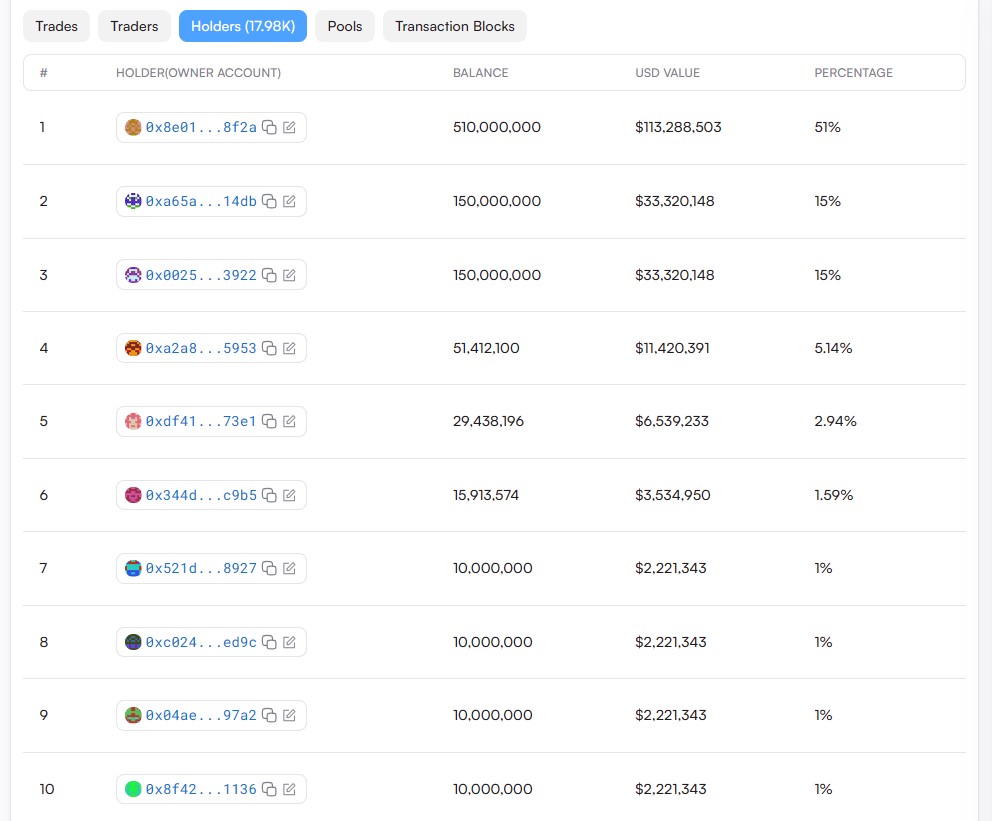
Holder data shows extreme concentration. The top wallet alone controls 510 million tokens, equal to roughly 51% of the total $MAGMA supply. The next two hold 15% each. Combined, the three addresses account for roughly 81% of the total MAGMA supply, although their exact ownership status and whether they are team, treasury, or exchange wallets should be verified on-chain.
We can't confirm whether these are team, treasury, or exchange wallets since none carry public labels on-chain. And that's exactly the risk. Unlabeled whale wallets this large can move price violently in either direction without warning.
CertiK rates the project 4.3 out of 5, a decent score, but it doesn't offset supply concentration risk.
Liquidity, Volume, and Liquidation Data
Liquidation data tells its own story. Over the past 24 hours, Coinglass shows $279.45K in total liquidations, split roughly $121K long and $158K short. Shorts got squeezed harder over the full day.
But zoom into the last hour and the picture flips. Longs lost $19.15K, shorts barely $2.56K, matching that intraday pullback from the daily high. Momentum traders are already testing both sides.
Volume was concentrated across centralized exchanges, with Binance, LBank, Bybit, Bitget, and MEXC among the more active venues. Exchange-level volume figures should be cross-checked against the same 24-hour window before publication. That spread acrossmultiple listing venues gives the token real exit liquidity, which thin DeFi-only tokens often lack.
Magma Finance and the Sui DeFi Ecosystem
$MAGMA isn't a meme play. It's positioned as infrastructure, the kind of altcoin that lives or dies with the health of its host chain. Sui's DeFi total value locked has been climbing through 2026, and Magma wants a cut of that liquidity flow.
And that's the real bet here. If Sui DeFi keeps growing, a liquidity-focused protocol like this one benefits directly, not just from hype. If Sui stalls, $MAGMA stalls with it.
Watching howbroader crypto-market news develops around Sui adoption and new protocol launches will matter more here than most single-coin headlines. Worth tracking anynew airdrop or incentive programs tied to the ecosystem too, since those tend to pull fresh liquidity toward tokens like MAGMA.
Magma Finance Price Prediction: Bear, Base, and Bull Scenarios
Timeframe
Bear Case
Base Case
Bull Case
Probability
Invalidation
7 Days
$0.15-$0.17
$0.19-$0.24
$0.28-$0.32
Bear 30% / Base 45% / Bull 25%
Loss of $0.154 support flips bias bearish
30 Days
$0.10-$0.13
$0.18-$0.26
$0.32-$0.40
Bear 35% / Base 40% / Bull 25%
Weekly trade below $0.070 or reclaim above $0.323 with volume
Early 2027
$0.08-$0.10
$0.25-$0.40
$0.55-$0.70
Bear 25% / Base 45% / Bull 30%
Sustained loss of $0.070 voids recovery; reclaiming $0.525 voids bear case
This isn't a guarantee, and nobody should treat it as one. Magma Finance price prediction work like this leans on structure, volume, and supply data, not certainty. Anyone comparing this against thebroader price-prediction dataset will notice similar setups don't always resolve the same way twice.
Risks to This Magma Finance Forecast
Supply unlocks remain the biggest overhang. Roughly 81% of total supply isn't circulating yet, and any scheduled release could pressure price regardless of chart structure.
Regulatory noise adds another layer. OngoingEU MiCA enforcement actions against smaller platforms show regulators aren't slowing down, and mid-cap DeFi tokens aren't immune to exchange-level compliance shifts.
Macro risk sits in the background too. Shifts around U.S. policy, including ongoingClarity Act developments and Federal Reserve leadership questions, can swing risk appetite across the entire altcoin market in hours.
Liquidity is thin. A 3.54% liquidity-to-market-cap ratio means large orders can move price fast, both up and down. Fine for traders chasing volatility. Riskier for anyone parking size.
Final Take on the Magma Finance Price Forecast
The rally is real, the chart structure improved, and Sui's DeFi narrative gives $MAGMA a story beyond pure speculation.
But three wallets still hold 81% of the supply. That single fact should temper how much confidence anyone puts in short-term targets. Price can reclaim $0.32 fast. It can lose $0.15 just as fast.
Watch the $0.154 support and the $0.323 resistance zone closely over the coming days. Those two levels will likely decide which scenario in the table above plays out first.
Disclaimer: This article is for informational purposes only and does not constitute financial, investment, or trading advice. Cryptocurrency markets are highly volatile, and prices can change rapidly. Do your own research and consult a licensed financial advisor before making any investment decisions.