The price of MAGMA Finance has attracted attention because of the heavy downtrend seen in the MAGMA token even after its previous uptrend, which had seen the price of the token come closer to
The price of MAGMA Finance has attracted attention because of the heavy downtrend seen in the MAGMA token even after its previous uptrend, which had seen the price of the token come closer to its all-time high at the $0.80 mark.
The price of $MAGMA has fallen by more than 22% over the past week and is currently trading at $0.35.
During the coming Magma Finance price prediction, the current price performance, important supports and resistances, technical analysis, and causes for the downtrend witnessed in the past will be discussed.
Current Market Overview and Important data
Price: $0.3467 (-22.0% over 7 days)
24h range: $0.314 – $0.4251
Market Cap: $65.881M
Fully Diluted Valuation: $346.741M
24h Volume: $4.637M
Circulating Supply: 190M / Total & Max Supply: 1B (only 19% circulating)
Source: Data From Coingecko
Reasons for Decreasing $MAGMA and Magma Finance Price Prediction
1. Realizing Gains After Rallying
After MAGMA crossed the $0.80 level, many traders felt that it was the right time to be able to keep their gains, resulting in massive selling pressure.
2. Rejection by the Resistance Level
As $MAGMA was unable to maintain its price above the resistance level of $0.57, the sellers took over the control and pushed the prices down.
Magma Finance Price Prediction – Liquidations & Volume
Liquidations: In 24h, $245.35K got liquidated—mostly longs ($192.05K) vs. shorts ($53.29K). 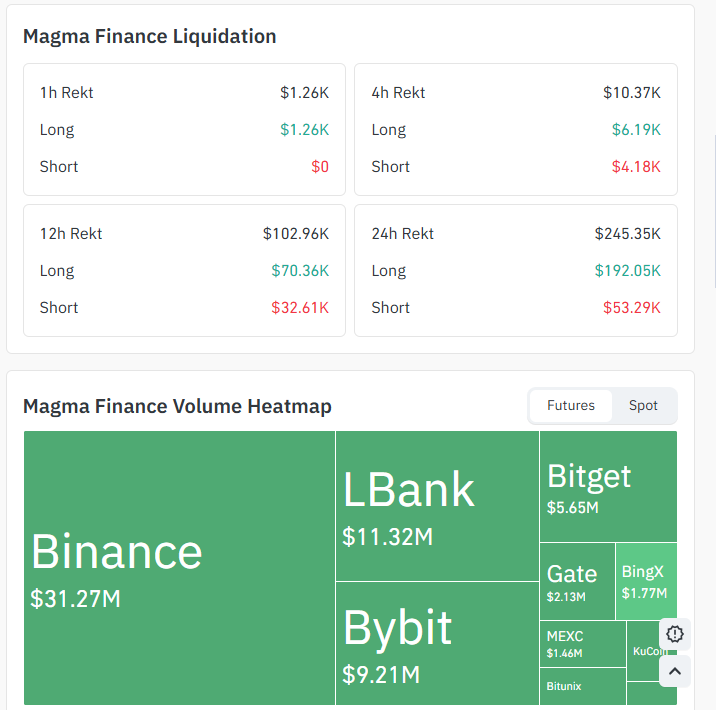
This means long traders (betting on price going up) got hurt the most, confirming the recent price drop caught bulls off guard. Even in the last 1h, only longs got liquidated ($1.26K), showing continued downside pressure.
Volume Heatmap: Trading is heavily concentrated on Binance ($31.27M), followed by LBank ($11.32M) and Bybit ($9.21M)—Binance alone handles the majority of $MAGMA futures activity, meaning price action there has an outsized influence on the token's moves.
SourceData by CoinGlass
Magma Finance Price Prediction and its Recent Developments
$Magma Finance is making further advancements in its liquidity platform development in the Sui blockchain network.
The company has released an update on $Magma 2.0, which seeks to improve routing efficiency, execution performance, and capital efficiency in the liquidity pool.
In spite of the recent correction, these developments could prove beneficial in the future.
Magma Finance Short-Term Technical Analysis
According to Short-term, $MAGMA is in an uptrend despite a correction due to the price not being able to sustain itself above its previous highs.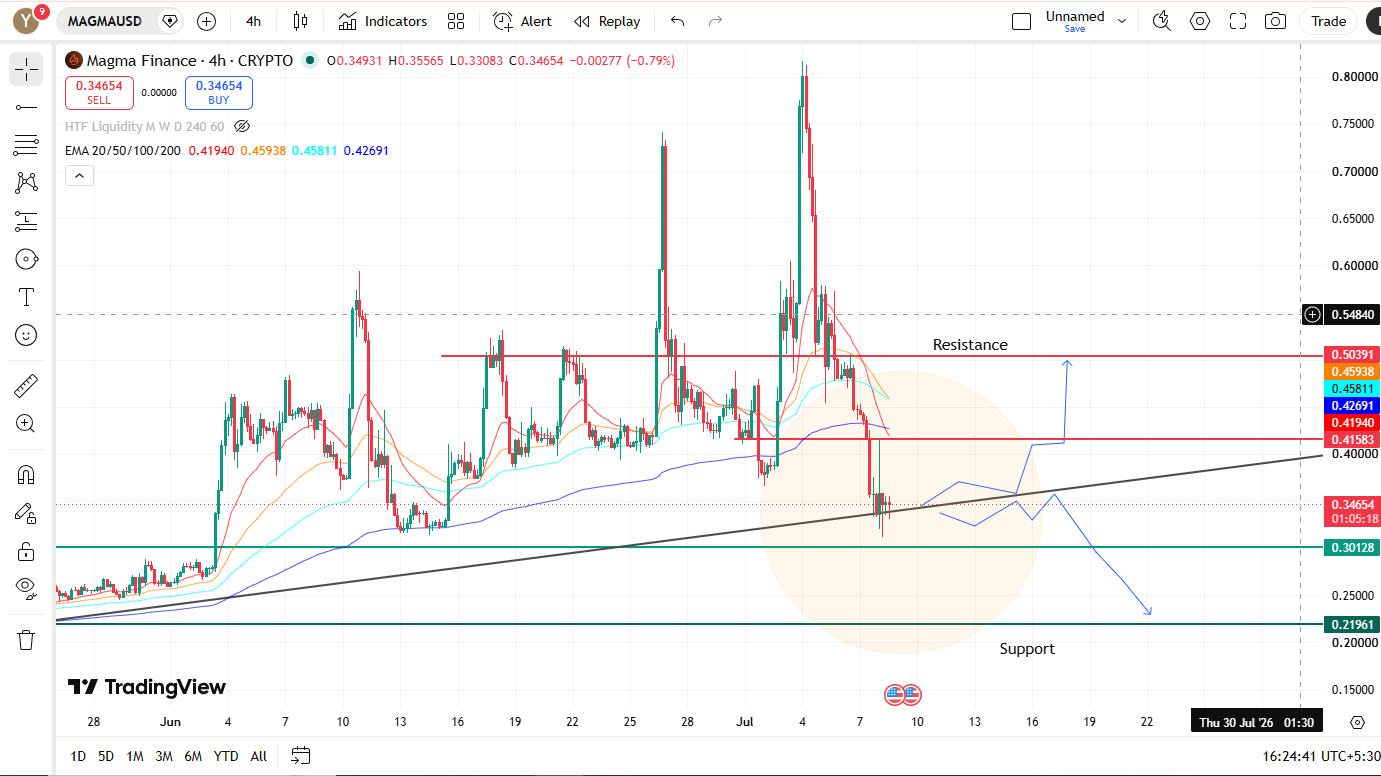
It is an indication that short-term momentum has been weak.
However, the fact that the RSI is around 45 means that there is bearish momentum. As such, selling pressure will prevail until the 20 EMA is regained by the bulls.
Magma Finance Price Prediction and its Support and Resistance
Key Support Levels
Support 1:$0.3013
Support 2:$0.2196
Key Resistance Levels
Resistance 1:$0.4158
Resistance 2:$0.5039
If buyers successfully defend the $0.3013 support zone, $MAGMA could stage a short-term recovery toward the first resistance at $0.4158.
However, if sellers break below the $0.3013 support, bearish momentum could strengthen, increasing the chances of a decline toward the next major support at $0.2196.
Where to Expect MAGMA's Price to Go in the Long Term?
$MAGMA is currently trading in the area of a critical support level at the 100 EMA ($0.3211) and also respecting a rising trendline, which marks an important technical level from a long-term perspective.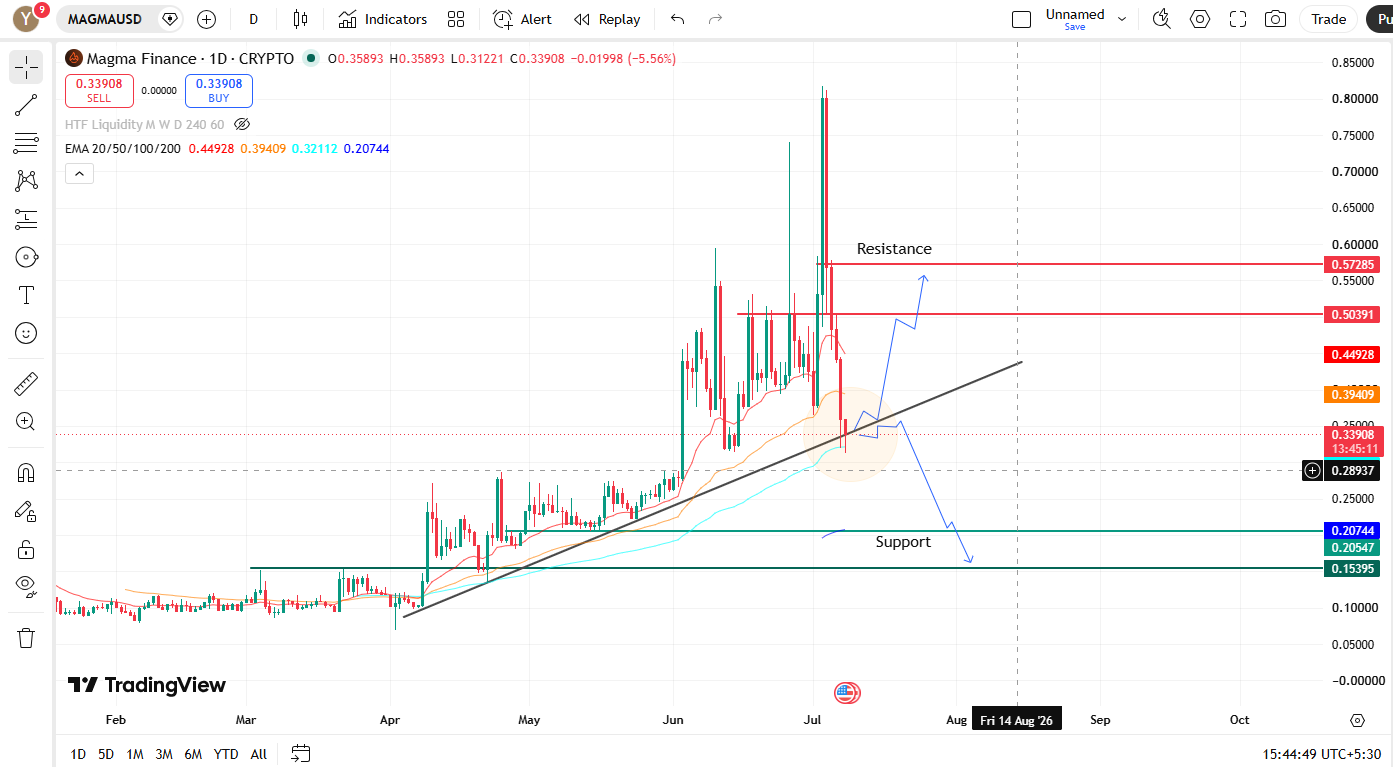
If the price hunts liquidity, then the view is it can go to the upper levels 0.5039 and can move to the 0.57285 levels or the resistance area.
On the other hand, if the bears manage to force the price down below the $0.3211 level, bearish momentum might build up, resulting in a fall towards the $0.1539 support zone.
Key Support Levels
Key Resistance Levels
Disclaimer: The above content is purely for educational purposes and should not be taken as any form of financial, investment, or trading advice. Cryptocurrency prices can be extremely volatile; do your own research.