Something unusual is happening in Sui's DeFi corner, and traders can't stop talking about it. A token that barely showed up on most watchlists a few weeks back is suddenly one of the loudest
Something unusual is happening in Sui's DeFi corner, and traders can't stop talking about it. A token that barely showed up on most watchlists a few weeks back is suddenly one of the loudest names on crypto Twitter. Builders keep hinting at a bigger version of their platform, and the market seems to be pricing that in fast. But is this real momentum, or just another altcoin flash before it fades?
Why $MAGMA Is Turning Heads Across Crypto Markets Today
This Magma Finance price prediction starts with a simple fact: $MAGMA has become one of the sharpest movers in the Sui ecosystem this week.
Turns out, most of that strength traces back to a broader rotation into high-beta altcoins.
Basically, whenBitcoin cools off a little, traders start hunting for coins that move faster. $MAGMA fit that description this week.
But strength without structure rarely lasts. So where does $MAGMA actually go from here?
Magma Finance At A Glance: The Key Numbers Right Now
MetricValueCoin NameMagma FinanceTicker SymbolMAGMABlockchainSuiToday High$0.6012Today Low$0.3826RSI Level69.73Token TypeUtility / Governance TokenToken CategoryDeFi Liquidity InfrastructureMarket Cap$113.04M24H Trading Volume$9.16M24H Trading Volume Change+147.43%Circulating Supply190M MAGMA24H Change+52.78%
Source: Data by CoinMarketCap
What Exactly Is Magma Finance And Why It Exists
Magma Finance runs on the Sui network as an adaptive liquidity engine for DeFi trading pairs. $MAGMA is its native token, used for governance, LP rewards, and tiered access.
How Far Has $MAGMA Come Since Its April Lows
$MAGMA touched an all-time low near $0.0697 back in April 2026. It peaked around $0.73 in late June and is now down just 18.3% from that high after this latest push.
Is Magma Finance More Than Just Another Sui Altcoin
Liquidity infrastructure rarely gets attention until it breaks, and that's the gap $MAGMA Finance wants to fill. Its CertiK rating sits at 4.3, adding credibility beyond hype.
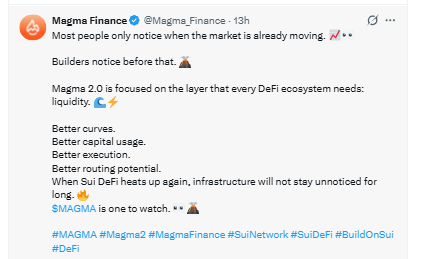
What The $MAGMA Finance Team Is Saying About Magma 2.0
Recent posts describe $MAGMA 2.0 as a stronger liquidity layer built for deeper execution on Sui.
Turns out, the messaging stayed consistent across three posts this week: better routing, better execution, and more eyes on the token.
Traders can track official updates through thecoin events calendar alongside these posts.
Source: Posted on X by Magma Finance
How Much Leverage Got Wiped Out In This $MAGMA Move
The last 24 hours saw about $305.61K in total liquidations. Short sellers got caught off guard.
TimeframeLong LiquidatedShort LiquidatedTotal Liquidated1 Hour$1.15K$20.62K$21.77K4 Hours$19.40K$53.41K$72.81K12 Hours$125.34K$158.89K$284.23K24 Hours$136.28K$169.33K$305.61K
Source: Liquidation data by CoinGlass
Does $MAGMA Finance Have Real Fundamentals Behind The Hype
With a fixed max supply of 1 billion and only 190 million circulating, future unlocks remain a real factor. Governance and LP rewards give the token real utility.
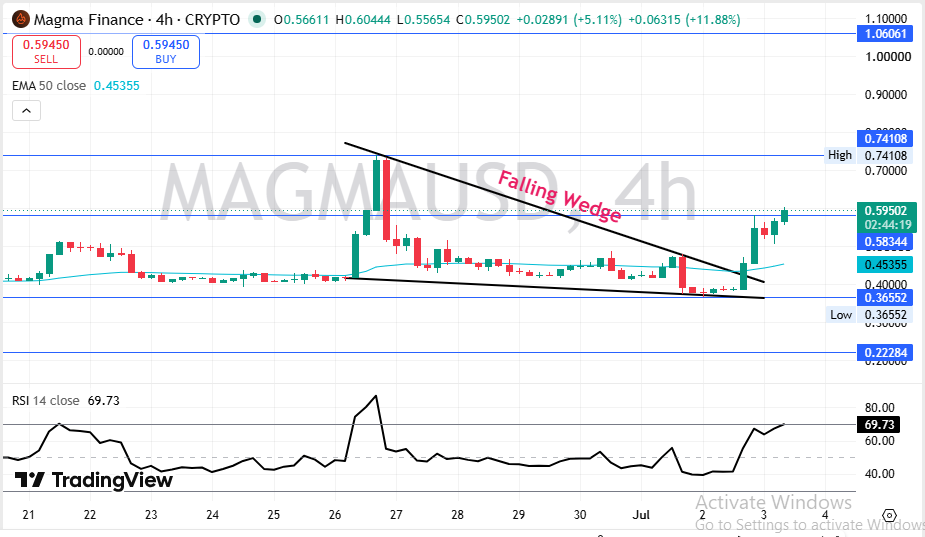
Technical Analysis: Breaking Down The Falling Wedge On The $MAGMA Price Chart
A falling wedge is a pattern where price keeps making lower highs and lower lows, but the range gets tighter and tighter, like the move is running out of steam. Breaking above it usually signals sellers are losing control.
Source: Charting by TradingView
The 50 EMA smooths out short-term noise to show the general trend. $MAGMA sitting well above it, at $0.595 versus $0.454, means buyers aren't just testing the waters; they're driving price.
RSI measures how fast and how far price has moved. At 69.73, it's getting close to the 70 mark that usually flags overbought conditions, so some cooldown wouldn't be surprising even in a strong trend.
On levels, $0.741 is the next real wall; clear it with volume, and $1.06 opens up. $0.366 is the safety net below, and $0.223 is where the bullish case breaks down completely.
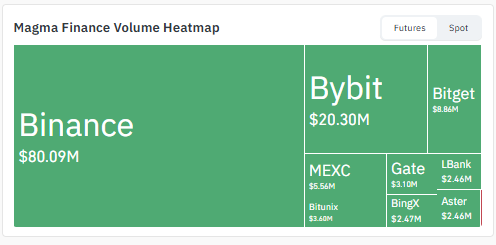
Where Is All The $MAGMA Trading Volume Coming From
Binance dominates $MAGMA volume with $80.09M, dwarfing every other venue. Bybit follows at $20.30M, with Bitget, MEXC, and a few smallercrypto exchanges making up the rest.
Source: Volume Heatmap by CoinGlass
How $MAGMA Stacks Up Against Other Sui Ecosystem Tokens
$MAGMA's move looks similar to theMemeCore price prediction story this week, both riding the same altcoin rotation.
The broaderaltcoin market has stayed focused on capital flowing away from majors and into smaller caps.
Where Could $MAGMA Price Head In The Coming Days
Short term, $MAGMA needs to hold above its EMA support to keep this structure intact.
TimeframeBearish TargetBase TargetBullish TargetKey Trigger24 Hours$0.52$0.60$0.68Wedge breakout follow-through3–7 Days$0.45$0.58$0.74Trading volume remains above average2–4 Weeks$0.38$0.55$0.90Broader altcoin rotation continues
Watch the $0.45 EMA zone closely; it decides the next move.
What Does 2027 Realistically Look Like For $MAGMA
In the long term, $MAGMA's fate ties closely to whether Sui DeFi activity keeps growing and Magma 2.0 delivers.
TimeframeBearish TargetBase TargetBullish TargetCatalyst Needed3 Months$0.30$0.55$0.85Magma 2.0 mainnet adoption6 Months$0.25$0.60$1.10Growth in Sui DeFi total value locked (TVL)End of Year$0.20$0.65$1.30Sustained exchange trading volume2027 Outlook$0.15$0.70$1.60Broader altcoin market cycle recovery
The long-term case leans hopeful but still depends heavily on execution.
Bull, Bear, And Base Case Paths For Magma Finance
Worst Case: Bitcoin drops and drags altcoins lower. $MAGMA loses the $0.45 EMA support and slides toward $0.36 or below.
Base Case: $MAGMA consolidates between $0.45 and $0.65 as Sui DeFi activity grows steadily.
Best Case: Magma 2.0 pulls in real liquidity. $MAGMA breaks $0.74 resistance and pushes toward $1.06.
ScenarioPrice RangeWhat Triggers ItWorst Case$0.20 – $0.36Bitcoin weakness triggers a broader risk-off market environmentBase Case$0.45 – $0.65Steady ecosystem growth with stable trading activityBest Case$0.74 – $1.06Magma 2.0 launch drives meaningful adoption and demandThe Exact Price Zones Every $MAGMA Trader Should Know
Resistance zones: $0.741 and $1.061, both marking prior swing highs.
Support zone: $0.366, the lower edge of the recent channel and a key EMA cushion.
Invalidation zone: $0.223; a close below here breaks the current bullish structure.
Our Take On Where Magma Finance Goes From Here
When we pulled up the $MAGMA chart, the first thing that stood out was how clean this channel breakout looked against the RSI.
Momentum is real, and $9.16M in 24-hour volume makes it hard to dismiss as noise.
A weekly close above the $0.45 EMA would confirm buyers are staying in control.
Worth tracking beyond the chart: broader market sentiment through theFear and Greed Index, since altcoin rallies like this tend to fade once risk appetite cools.
And that raises a bigger question: can Magma 2.0 turn attention into sticky liquidity? One the market hasn't answered yet.
The most important level to watch stays simple: $0.45. Hold it, and the bulls stay in charge.
Disclaimer: This article is for educational purposes only and does not constitute financial advice. Crypto markets are volatile. Consult your investment advisor before making any investment decision.