MemeCore (M) Price Explodes—Could a 100% to $3 Be Next?
Memecore (M) price has witnessed a significant upswing in the past few hours and attracted more than 20% gains, becoming the top performer in the crypto market. The token has reached $1.51, w
A
AnonymousCryptoCompass newsroom
July 14, 2026
2 min read
NEWS
CryptoCompass editorial visual for markets coverage.
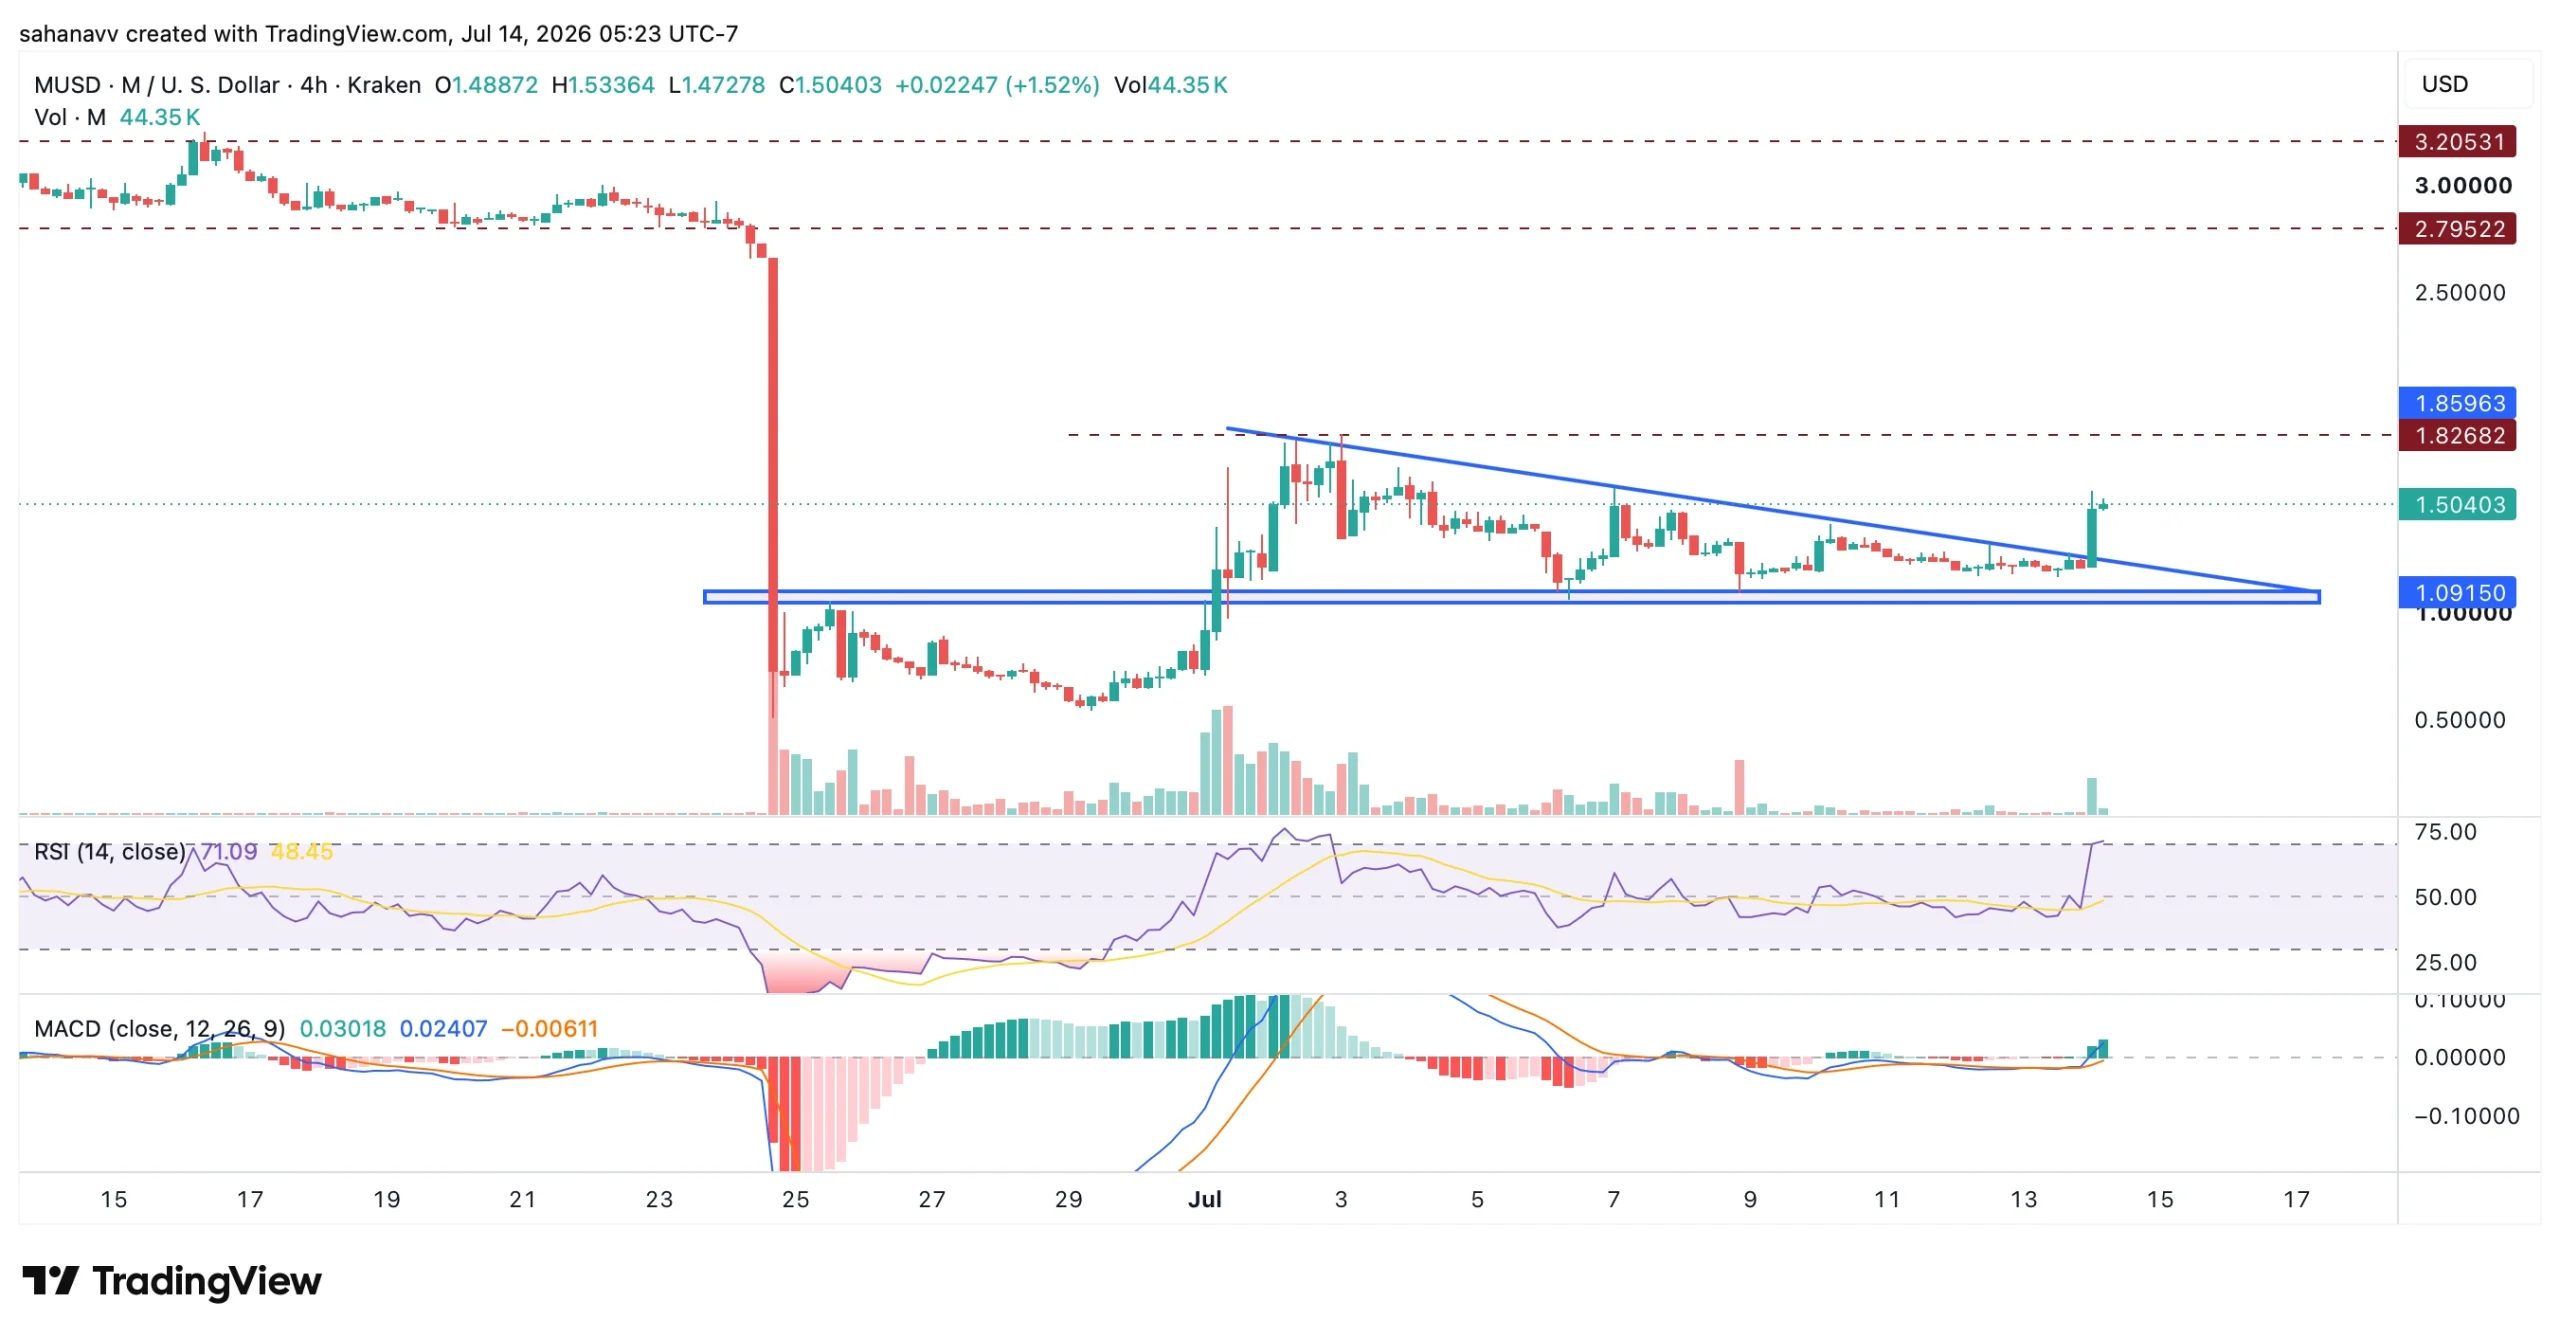
Memecore (M) price has witnessed a significant upswing in the past few hours and attracted more than 20% gains, becoming the top performer in the crypto market. The token has reached $1.51, while the trading volume increased by less than 1%. However, the price has broken above a bearish pattern, signalling renewed bullish momentum after an extended period of consolidation. With this, the price is approaching a pivotal resistance zone that may determine whether the bulls can extend the move or face another rejection.
After a sharp decline in late June, MemeCore established a strong demand zone around $1.09, where buyers consistently absorbed selling pressure. Currently, the price has broken above the descending triangle in the short term, charaterised by lower highs with a flat support base. As the price has pushed decisively above the descending trendline, the question arises whether the bulls will make it to higher targets, as there is no strong resistance between $1.82 and $2.80.
The buying volume has increased during the breakout, adding credibility to the move. Besides, the RSI has surged, entering overbought territory, reflecting strong bullish momentum and suggesting the possibility of short-term profit-taking. On the other hand, the MACD has completed a bullish crossover and the histogram has turned positive, indicating improving upward momentum. Overall, the technical structure is in favour of the bulls as long as the breakout level holds.
Key Levels to Monitor
Immediate Support: $1.09
Immediate Resistance: $1.83
Higher Resistance: $2.80
Long-Term Resistance: $3.20
MemeCore’s breakout from the descending triangle marks a meaningful shift in short-term market sentiment, supported by rising volume and strengthening momentum indicators. The next challenge for bulls is reclaiming $1.83. A decisive break above this resistance could open the door toward $2.80. Besides, a failure to sustain the breakout may result in a retest of the triangle breakout zone before the next directional move develops.
After several months of flirting with the psychological support level at $1.00, Ripple’s XRP finally dipped below it on a couple of occasions in the past week, which aligned with many analyst
No source in this evidence set shows Binance and Coinbase holding equivalent, currently-verified registrations in the same countries. The clearest documented facts are that Binance pleaded gu
Altcoin rotation could remain selective, with liquidity and network activity becoming important factors for market participants. RAY, ENA, CRV, VET, and OP represent different sectors, includ