MemeCore (M) has quietly recovered from recent lows, climbing 8.61% over the past 24 hours to trade near $1.08. But the real story isn't the bounce; it's the breakout attempt taking shape on
MemeCore (M) has quietly recovered from recent lows, climbing 8.61% over the past 24 hours to trade near $1.08.
But the real story isn't the bounce; it's the breakout attempt taking shape on the charts.
The 4-hour timeframe has already pushed above its descending channel, while the daily chart is still working through the same structure that has capped price for weeks.
That gap between timeframes is exactly what makes this MemeCore price prediction worth watching: has M genuinely turned a corner, or is this another short-lived recovery inside a longer downtrend?
Is MemeCore's Recovery Gaining Real Momentum?
M's 24-hour gain of 8.61% stands out against a much weaker recent history, and it's happening as buyers try to wrestle control back from a downtrend that has dominated the past several months.
There's no fresh news driving this move; it looks like a purely technical recovery, with price bouncing off lows and pushing into resistance.
The question is whether this marks the early stage of a trend reversal or simply a relief bounce inside a still-fragile structure.
Momentum has clearly improved, but it hasn't been proven over a longer stretch yet.
Are MemeCore Derivatives Confirming the Bounce?
Open interest sits at $20.59M, down from July's highs near $28M, showing traders have pulled back leverage rather than piled into the move.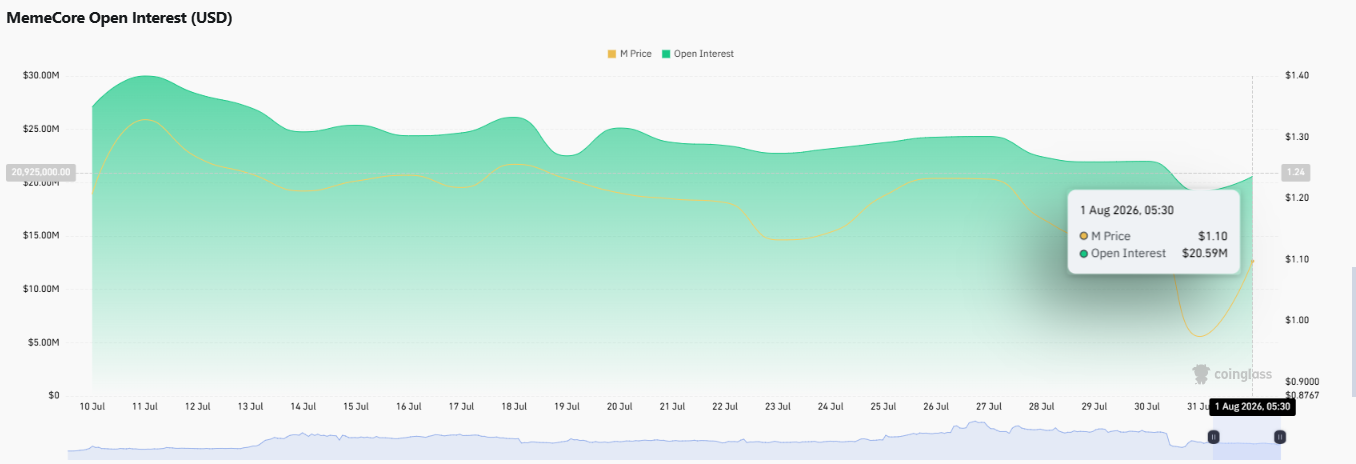
Positioning is mixed: Binance accounts show a long/short ratio of 0.9179, tilted slightly short, while Binance's top traders are split too; accounts lean short at 0.72. But top trader positions lean long at 1.4478.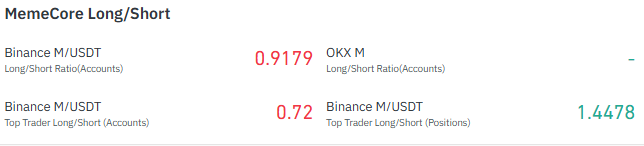
Liquidations over the past 24 hours total $97.03K, with longs ($52.42K) taking slightly more damage than shorts ($44.61K). Altogether, derivatives data shows a market that's cautious rather than convinced, with no clear one-sided commitment behind the recovery yet.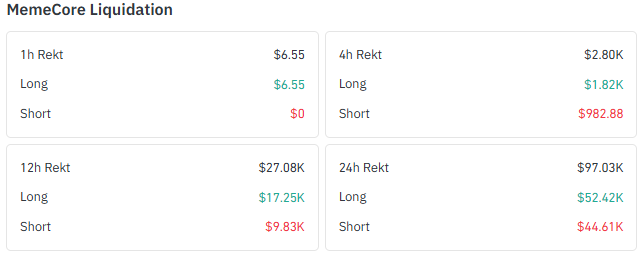
Data source: coinglass
Is MemeCore Recovering or Still Under Pressure?
MemeCore's near-term numbers look encouraging, up 8.61% over 24 hours, but that sits inside a much rougher stretch.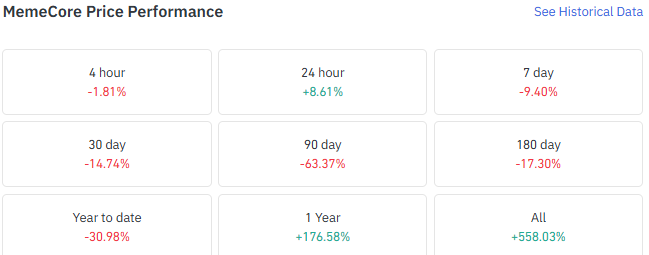 The token is down 9.40% over 7 days, 14.74% over 30 days, and a steep 63.37% over 90 days, with a year-to-date decline of 30.98%. Zoom out further, though, and the picture flips: M is still up 176.58% over the past year.
The recent bounce is a bright spot inside a longer, uneven trend.
Has the 4-Hour Chart Already Broken Out?
On the 4-hour TradingView chart, $M has pushed out of its descending channel, trading near $1.0849 with RSI at 47.75, still below the midpoint but recovering. Resistance sits at $1.16690, $1.31864, and $1.50664, while support is layered at $0.98887, $0.92314, and $0.85490.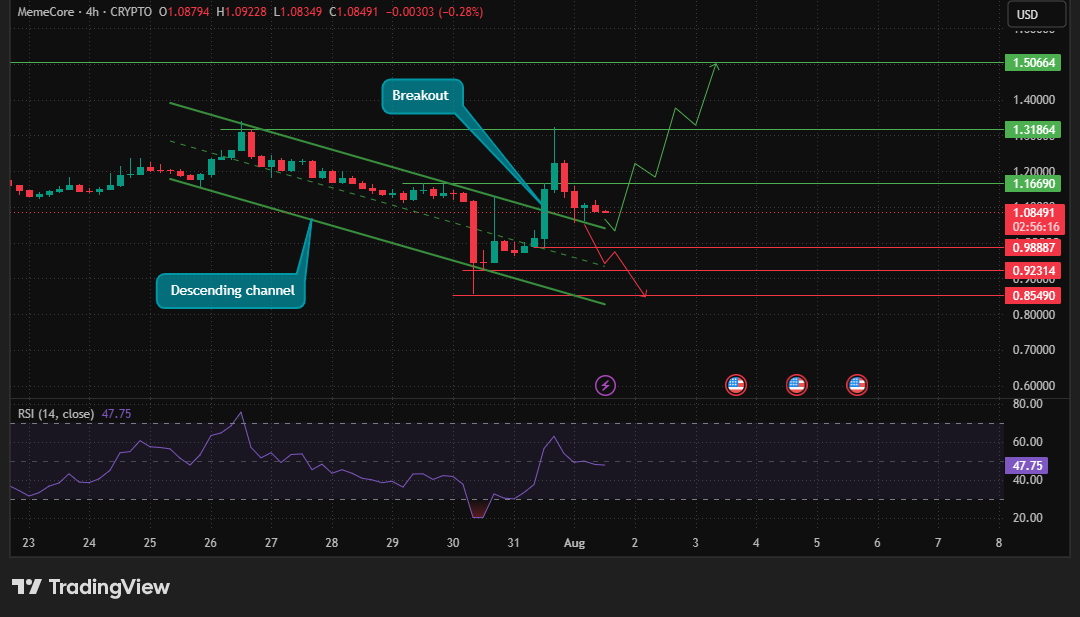
The breakout is encouraging, but it's still early: buyers need to hold above $0.98887 to keep the structure intact, and a confirmed push through $1.16690 would strengthen the case that the short-term trend has genuinely shifted.
Can MemeCore Escape Its Daily Descending Channel?
The daily chart tells a more cautious story. M remains inside a descending channel that has defined price action since June, with RSI at 39.33 still on the weaker side.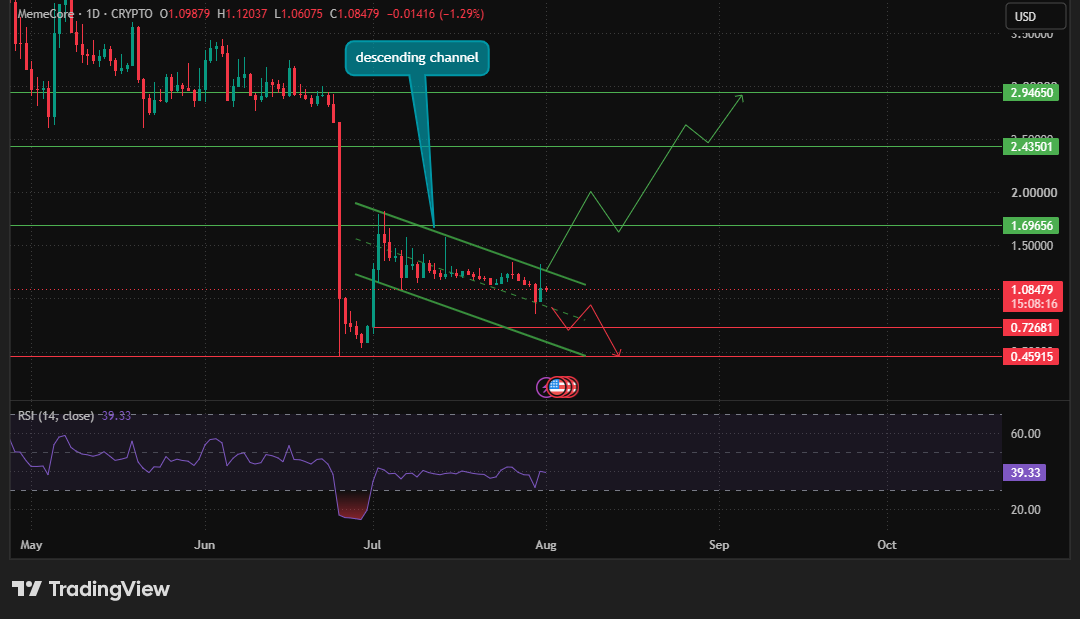
Resistance stands at $1.69656, $2.43501, and $2.94650, levels that only come into play if the channel breaks decisively.
On the downside, support sits at $0.72681 and $0.45915. A confirmed breakout above the channel would open the door toward the higher resistance zone, but until that happens, MemeCore's higher-timeframe trend remains bearish, with the recent bounce still needing daily confirmation.
Data source: tradingView
What Comes Next for MemeCore?
The scenarios below build on the technical levels established above.
Scenario
Trigger
Price Outlook
Bullish
Confirmed move above $1.16690, aligning with a daily channel breakout
Opens a path toward $1.31864 and $1.50664, with $1.69656 coming into view if the daily breakout extends.
Base Case
The price holds between $0.98887 and $1.16690
Continued consolidation as the market digests the bounce, with neither buyers nor sellers in clear control.
Bearish
Break below $0.98887 support
Reopens downside toward $0.92314 and $0.85490, keeping the daily channel's bearish structure intact.
How Should Traders Read This Setup?
$M has broken out of its descending channel and briefly tested the $1.31864 resistance before pulling back to retest the breakout zone. Holding above the channel with stronger volume would strengthen the bullish structure and could trigger another leg higher toward $1.50664.
A failure to hold the breakout, however, would push price back inside the channel, turning the recent move into a false breakout and increasing the chances of range-bound trading.
Disclaimer: This analysis is for informational purposes only and does not constitute financial advice. Cryptocurrency markets are volatile, and readers should conduct their own research before making investment decisions.
