13 quiet days. Is this a coin resting or a spring winding tight? Right now, Mirex Network price today reads $0.8011, and the MRX price prediction hangs on one stubborn line, while Mirex Netwo
13 quiet days. Is this a coin resting or a spring winding tight?
Right now, Mirex Network price today reads $0.8011, and the MRX price prediction hangs on one stubborn line, while Mirex Network Binance listing talk stays unconfirmed.
Earlier notes tracked the12-day range breakout watch. This Mirex Network price prediction picks up from there, with data stamped October 16, 2026, 03:56 UTC.
Mirex Network Price Today: Data Snapshot
Numbers come fromlive PancakeSwap pair data, checked on October 16, 2026, 03:56 UTC.
Metric
Value
Pair
MRX/USDT, PancakeSwap V2, BSC
MRX price
$0.8011
24H change
+0.95%
24H volume
$19K
Trades
300 (148 buys, 152 sells)
Liquidity
$50K
Market cap and FDV
$21.6M
Why Is MRX Moving Today?
MRX price is up 0.95% in 24 hours, with $19K in volume and buys against sells splitting 148 to 152.
The only live story is theSpin and Win KYC rollout, a staged identity check, short for know your customer. But price shrugged.
MRX Liquidity and Holder Risk
MRX liquidity means the cash in the pool that traders swap against. Here it's $50K, set against a $21.6M valuation. That pool holds 31,821 MRX and 25,492 USDT, roughly 0.23% of the valuation.
One wallet holds 9.88% of supply, about 2.6M MRX, worth $2.1M. So who absorbs the hit if that top wallet ever sells?
Scanners flag four Go+ issues and two Quick Intel issues. That's not proof of wrongdoing, but contract details deserve a check on theofficial Mirex website first.
MRX Technical Analysis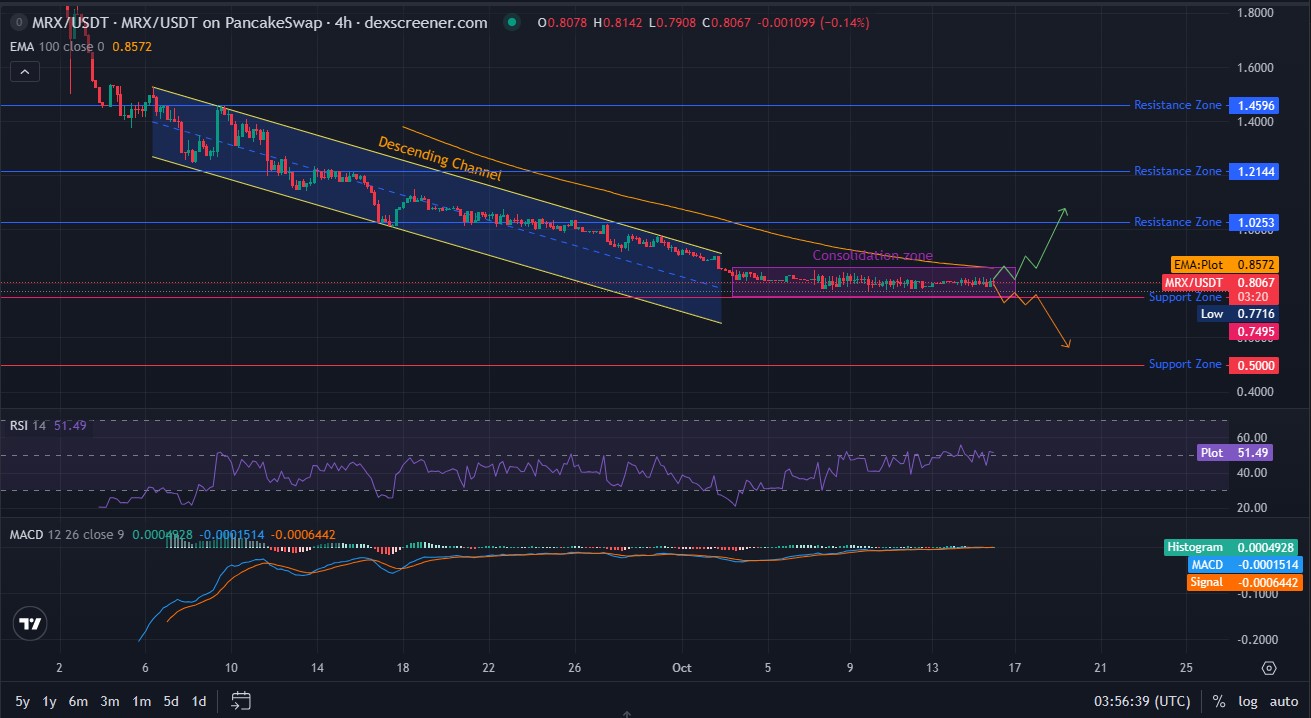
MRX technical analysis reads past trading to map where buyers and sellers might act next.
On the 4-hour chart, price slid inside a descending channel, meaning lower highs and lower lows. Then it flattened into a consolidation zone, a tight sideways range, in early October.
RSI is 51.49; it's dead neutral, neither overbought nor oversold.
The EMA 100 sits at $0.8572. That's 7.0% above spot, and it's still sloping down. Reclaim it, and the channel story changes.
MACD compares two moving averages to gauge momentum. Its line reads -0.0001514, the signal -0.0006442, and the histogram 0.0004928.
Bearish felt right a minute ago. But the positive histogram argues for a pause instead, and both lines hug zero, so momentum is a whisper. More setups sit on thecrypto price prediction hub.
MRX Support and Resistance Levels
MRX support and resistance zones come from the 4-hour chart.
Support Levels
Support is a level where buyers have stepped in before. The first sits at $0.7716, 3.7% below spot, then $0.7495, 6.4% lower.
Sellers held control through September, until buyers stepped in near $0.7716. Right where the floor sits now. Deeper support at $0.5000 is 37.6% away.
Resistance Levels
Resistance is a level where sellers have pushed back before. First comes the $0.8572 EMA, then $1.0253, $1.2144, and $1.4596.
And $1.0253 means a 28.0% climb. Hype such as theLumira ecosystem update hasn't cleared even the first level.
Squeeze Math: Reward Versus Risk
A 13-day squeeze packs risk into a thin band. From $0.8011, a test of the EMA means +7.0%, while a slide to the floor means -3.7%.
That's roughly 1.9 to 1. But math isn't a signal.
Mirex Network Binance Listing: What's Confirmed?
Mirex Network Binance listing talk keeps resurfacing. Nothing official backs it.
The chatter traces to the project's account resharing Binance commentary on tokenized real-world assets. A thematic nod, not a partnership.
MRX trades on PancakeSwap, a decentralized exchange on BNB Smart Chain. That's not a Binance listing, which would mean trading on the Binance exchange itself.
A real MRX Binance listing would arrive through official Binance announcements, with a named date and pair. TheTier 1 listing watch tracks that story.
Mirex Network Price Prediction for October 2026
This MRX price forecast stays scenario-based, with data stamped October 16, 2026, 03:56 UTC. Nothing here is a promise.
Bull Case
MRX could test $0.8572, then $1.0253, if trading breaks and holds above the EMA with volume well beyond $19K. A confirmed exchange notice, with a named date and pair, could add fuel. Invalidation: a slide under $0.7716.
Base Case
Sideways trading between $0.7716 and $0.8572 may continue through late October if volume hovers near $19K. A box like this tends to end one of two ways. Up, through the EMA. Or down, through the floor. Invalidation: a decisive break of either edge.
Bear Case
A break under $0.7716 could open $0.7495, then $0.5000, if sellers take over. Key risk: the 9.88% wallet. Invalidation: reclaiming $0.8572.
MRX Long-Term Price Forecast
Beyond a few weeks, numbers turn into guesses. The reported $1.92 sale price shows the distance. Recovering it would take roughly 2.4 times today's price, and thegap to the sale price stays wide.
Breakout Confirmation and Breakdown Risk
Breakout confirmation needs sustained trading above $0.8572 with rising volume.
Breakdown risk begins under $0.7716. Dates that could shift sentiment sit on theupcoming coin events calendar.
Risks That Could Change the Mirex Network Price Prediction
Four risks matter here. A thin $50K pool. One wallet at 9.88%. Six scanner flags. And Binance listing talk with no notice.
Fresh tokens often show these traits, aspresale and IDO listings coverage explains. But liquidity decides how violent the next move gets.
Final Takeaway
Neutral RSI, flat MACD, tight range. The lean stays bearish under $0.8572 and turns cautiously bullish only above it.
This Mirex Network price analysis says one thing. Volume and verified news must arrive together.
Disclaimer: This article is for information only and isn't financial advice. Small-cap tokens carry high risk, including total loss. Scenarios aren't guarantees. Data reflects October 16, 2026, 03:56 UTC.