Did a falling wedge just hand MRX a second chance? That's the puzzle behind this Mirex Network price prediction, which rests on chart and pair data from 04:15 UTC on November 6, 2026. MRX tra
Did a falling wedge just hand MRX a second chance?
That's the puzzle behind this Mirex Network price prediction, which rests on chart and pair data from 04:15 UTC on November 6, 2026.
MRX trades at $1.0651, up 4.15% in 24 hours, after theoverbought MRX rally faded.
Sellers held the pen for days. Buyers just grabbed it back.
Mirex Network Data Snapshot
Numbers below come fromPancakeSwap pair data at 04:15 UTC on November 6, 2026.
Metric
Reading
Price
$1.0651
24H change
+4.15%
24H volume
$20K
Liquidity
$55K
Market cap
$28.7M
Holders
1,068
Buyers and sellers sit almost level, with $10K against $9.9K. But only 12 traders took part, and 24H volume more than doubled the $9.2K logged.
What the Mirex X Post Adds
The latestofficial Mirex post on X went live roughly 21 hours before this snapshot and covers tokenization infrastructure.
It stresses transparency and community, calls the project early-stage, and names no dates or launch figures.
But the post isn't a trigger for this chart. Price moved on a wedge break, and a 4.15% daily gain fits technicals better than news.
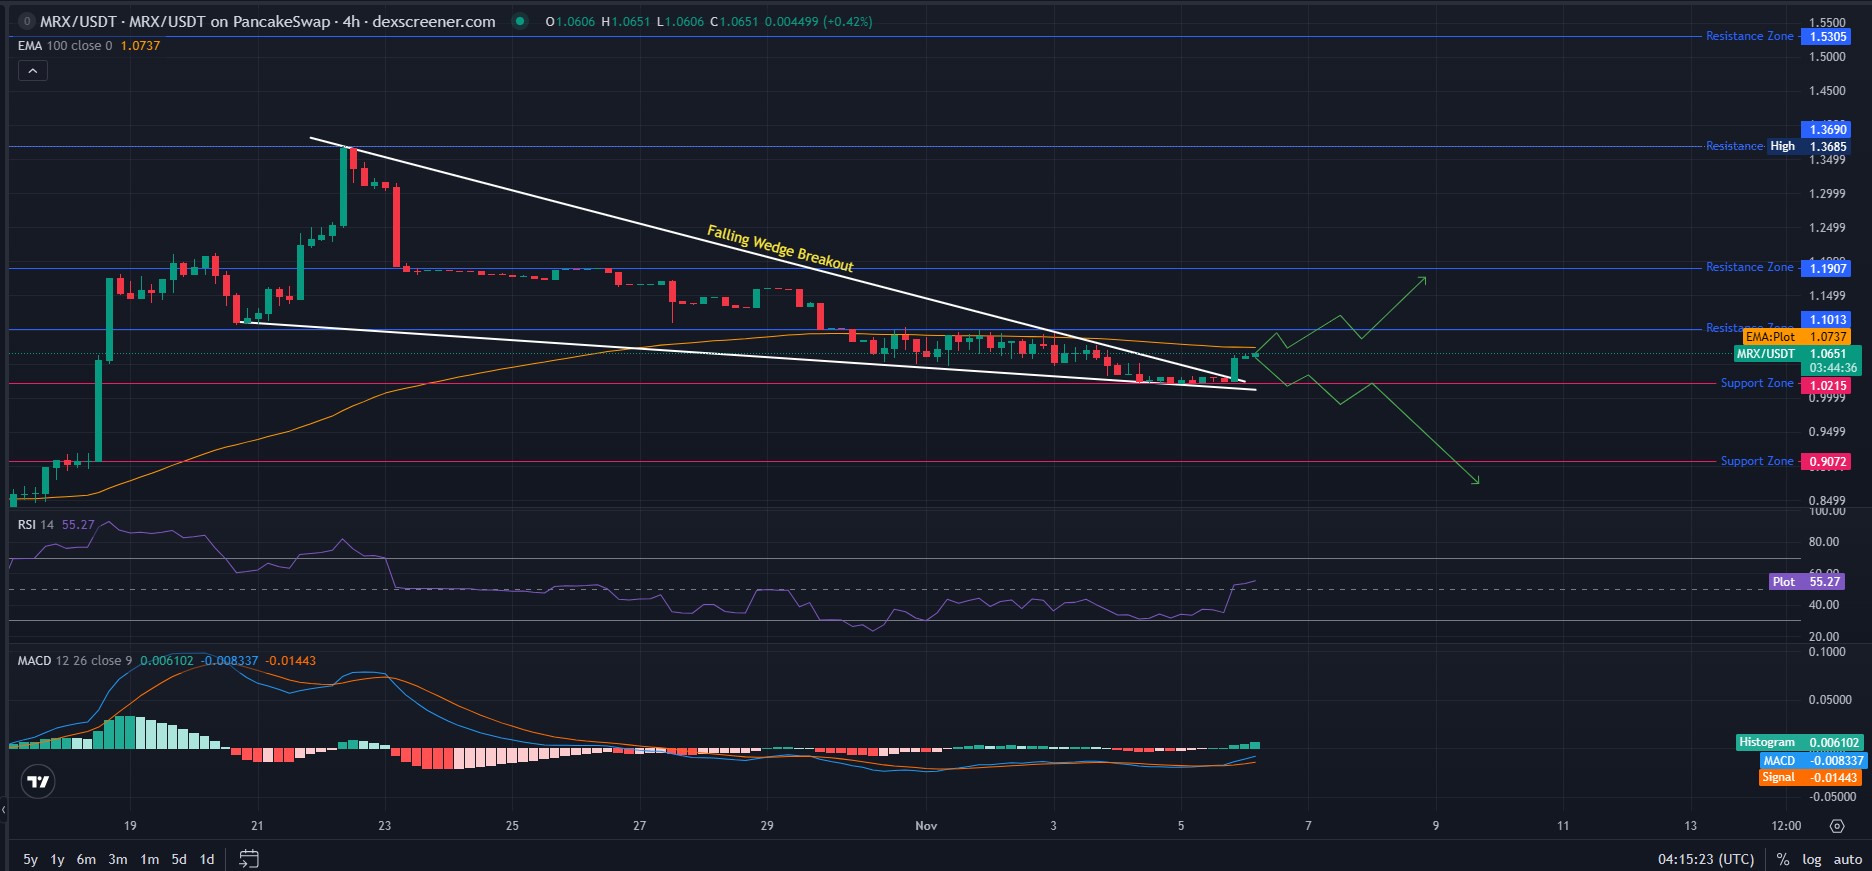
This Mirex Network price analysis starts at the left edge of the 4-hour chart, with MRX sitting in the high $0.80s and buyers just waking up.
And a wall sits overhead. The 100 EMA, a trend line weighing recent trades most, stands at $1.0737, 0.8% above the spot.
That base came from theprevious range breakout watch, and buyers stacked green candles out of it.
The push topped near $1.18, chopped sideways, then spiked to a peak at $1.3685 before sellers dragged the price back to $1.1907.
The price sat flat there for days.
From there the chart bled, sliding toward $1.1013, slipping under the 100 EMA and printing lower highs.
Highs fell faster than lows, squeezing the price between converging downward lines. Chartists call that a falling wedge, and it often resolves upward.
Then the final green candle broke the upper line. And kept going, lifting the price off the $1.0215 floor. RSI shows 55.27 reading.
What RSI and MACD Say Now
Buyers have room here, since RSI sits above the 50 midline and well under the 70 overbought mark.
MACD agrees, with its line at -0.008337 crossing above the signal line at -0.01443.
Call it a clean reversal. Actually, hold that thought, since both lines still sit below zero and early crosses fail often.
The 100 EMA is the first real test. A hold above $1.0737 flips it to the floor.
Support and Resistance Levels
MRX support starts at $1.0215, 4.1% below spot, then $0.9072.
Resistance begins at $1.0737, then stacks up at $1.1013, $1.1907, $1.3690 and $1.5305, with $1.3690 needing a 28.5% gain.
Holders and Pool: Who Moves MRX?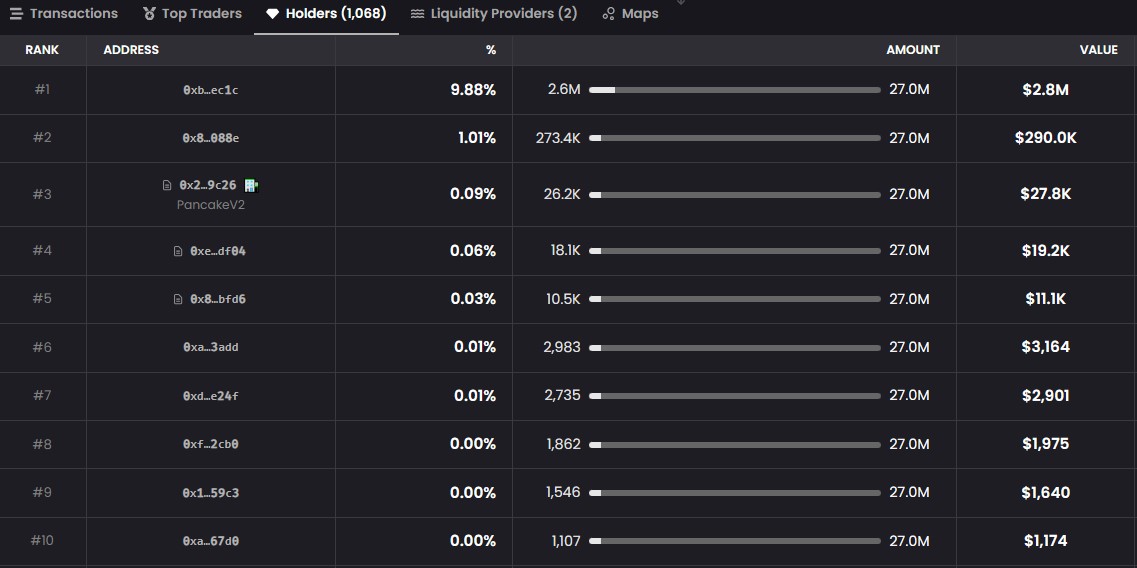
Holder data shows 1,068 wallets, down from 1,083.
The top wallet holds 9.88% of the 27.0M supply, about 2.6M MRX worth $2.8M, while the PancakeV2 pool contract holds just 0.09%.
So what happens if a $2.8M wallet sells into a $55K pool?
Nothing shows that wallet moving. But the gap, about 51 times the pool, frames every target, andholders versus traders covers how patient and active wallets split.
Liquidity Against Market Cap
MRX liquidity sits at $55K against a $28.7M market cap, a ratio near 0.19%.
That's why modest orders move prices. And athin pool depth risk already showed up, with the pool shrinking from $58K earlier.
Only two liquidity providers back the pool.
MRX Price Forecast Scenarios From $1.0651
This MRX price forecast leans bullish while $1.0215 holds, and the table below maps each path.
Scenario
Trigger
Target
Invalidation
Liquidity Condition
Bullish
Trades above $1.0737 on volume past $20K
$1.1013, then $1.1907
Trades under $1.0215
Pool grows past $55K
Neutral
Trades between $1.0215 and $1.0737
Same range
Break of either edge
Pool stays near $55K
Bearish
Trades under $1.0215
$0.9072
Reclaim of $1.0737
Providers pull funds
Reclaim $1.0737 and hold it with volume past $20K. Then this Mirex Network price prediction opens $1.1013 within 24 hours and $1.1907 within a week.
And a break under $1.0215 sends MRX toward $0.9072, a 14.8% drop; a $55K pool would only speed up.
Far bigger numbers, like the$5 target debate, need depth this pool lacks.
Mirex Network Price Outlook Beyond This Week
But beyond this week, no dated catalyst anchors a Mirex Network price outlook, and none is confirmed.
Pattern traders add a wedge's widest height to the breakout point, and here that math lands near $1.3690, the old peak.
That needs $1.1013 and $1.1907 to hold, so an MRX price projection that far is a stretch.
Utility drives price once usage shows up, andMRX token utility covers that case.
What Could Flip the Setup
A confirmed exchange listing would add order books beyond PancakeSwap, yetTier 1 listing talk stays talk without a notice.
Risks and the Final Read on MRX
Risks are plain. A $55K pool, a 9.88% top wallet, 12 active traders, and a MACD still under zero all cut against the bulls.
Contract details deserve a check on theofficial Mirex website. Before any wallet connects.
This Mirex Network price prediction stays bullish above $1.0215, turns confirmed above $1.0737, and flips bearish under $1.0215.
Disclaimer. This article is for information only and isn't financial, investment, or trading advice. Crypto, especially small-cap tokens on decentralized exchanges, carries high risk, including total loss. Scenarios aren't forecasts or guarantees. Data was captured at 04:15 UTC on November 6, 2026, and it changes fast. Always do independent research first.