Key Highlights Traders are turning bearish, with 53.8% of positions across exchanges now short. Monero is forming a double top, with a breakdown below support targeting $303. A daily close ab
Key Highlights
- Traders are turning bearish, with 53.8% of positions across exchanges now short.
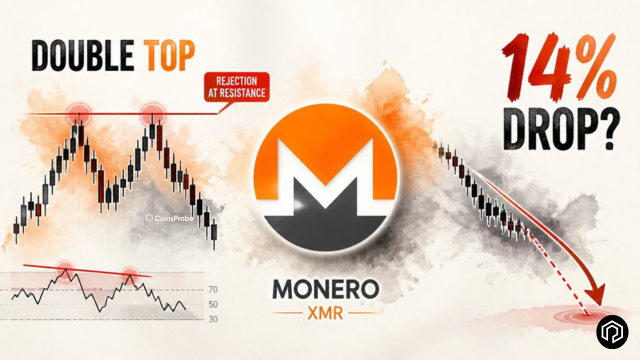
- Monero is forming a double top, with a breakdown below support targeting $303.
- A daily close above $365 would invalidate the bearish setup.
Monero’s combination of a technically defined double top on the daily chart, short-side sentiment dominance across five of six major exchanges, and a confirmed rejection from the $365 second peak creates one of the more specific bearish setups visible in the current crypto market. Here is the complete picture — with the specific levels that determine the outcome.
XMR is trading at $353.45 — down -2.27% in 24 hours — with a market cap of approximately $6.64 billion. Despite the near-term bearish setup, XMR remains +11.61% over 30 days — reflecting the genuine demand for privacy assets that has sustained Monero’s relatively strong positioning throughout 2026’s broader altcoin weakness.
 Monero (XMR) Price on 05 Aug 2026/Source: Coinmarketcap
Signal 1 — Exchange Sentiment: 53.84% Short Across All Venues
Exchange long/short ratio data provides real-time insight into how traders are positioning across venues — and the current picture shows a consistent short-side bias that aligns with the technical setup:
 XMR Long Vs Short Orders on Exchanges/Source: coinank
Reading the data:
Exchange data shows a slight tilt toward the short side. Across all exchanges, longs account for 46.16% while shorts stand at 53.84%.
The aggregate 53.84% short positioning reflects the market’s current directional lean — participants with active positions in XMR are leaning toward a decline rather than a continuation of the 30-day recovery. This short-side dominance aligns directly with the double top pattern forming on the daily chart.
The contrarian caveat: Heavy short positioning can also create conditions for a short squeeze — if XMR were to break above the $365 resistance with conviction, the concentrated short positions on Bybit, Huobi, Aster, and Hyperliquid would face forced covering that could produce a sharp upward move. This is why the $365 invalidation level carries additional significance beyond pure pattern analysis.
Signal 2 — Double Top on the Daily Chart
The daily chart is showing a classic double top — one of the most recognisable and historically reliable bearish reversal patterns in technical analysis.
XMR’s double top:
Both peaks of XMR’s double top have occurred near $365 — the level where price rejected both times rather than continuing higher. Following the second rejection, price has pulled back to the current $353.45 — approximately -3.2% below the second peak — with the pattern now in the confirmation phase where the key support test will determine the outcome.
 Monero (XMR) Daily Chart-Coinsprobe/Source: Tradingview
The $334.68 support — 50-day MA convergence:
The next major support sits at $334.68 — a level made more significant by its convergence with the 50-day moving average. When a key support level and a major moving average align at the same price, the combined significance is greater than either would be independently — more participants reference both levels simultaneously, creating denser demand concentration at that zone.
A sustained break below $334.68 — particularly on a daily closing basis rather than just an intraday wick — would confirm the double top’s breakdown and activate the measured move.
The $303.46 measured move target:
The double top measured move is calculated by projecting the pattern’s height (distance from the neckline to the peaks) below the neckline breakdown point. For XMR’s current pattern, this calculation produces a target of approximately $303.46 — representing approximately -14% downside from the current price of $353.45.
From a historical context, $303 represents a significant psychological level — below the $300 round number that has served as a reference point for Monero in prior cycle periods. A move to $303 would bring XMR back toward levels not seen since before the 30-day recovery that produced the +11.61% gain.
Bearish Scenario — $334.68 Breaks, $303.46 Activates
XMR fails to hold the $334.68 support/50-day MA convergence — with a sustained daily close below this level confirming the double top breakdown. This activates the $303.46 measured move target — approximately -14% additional downside from the current $353.45. The 53.84% short positioning across exchanges would amplify the downside move rather than resist it, as the dominant positioning aligns with the direction of the breakdown.
Bullish Invalidation — Close Above $365
A daily close back above $365 — the level of both double top peaks — would invalidate the bearish setup entirely. This scenario would require XMR to overcome both the double top resistance and the concentrated short positioning on multiple exchanges simultaneously — but if achieved, would signal the pattern has failed and shift the short-term bias back to bullish. The concentrated short positioning on Bybit, Huobi, and Hyperliquid would then become fuel for a short squeeze, potentially accelerating the upside move beyond what a typical breakout might produce.
Bottom Line
Monero’s +11.61% 30-day recovery has stalled at a double top rejection near $365 — with short sentiment at 53.84% across all exchanges and a confirmed second peak failure setting up the classical bearish resolution toward $303.46 (-14%) if the $334.68 support/50-day MA breaks on a sustained basis.
The setup is binary and level-based: $334.68 is the pivot that decides the near-term direction — its break activates the $303.46 target, while a recovery above $365 invalidates the double top entirely and turns the concentrated short positioning into potential short squeeze fuel.
Watch the $334.68–$365 zone closely in the sessions ahead.
Disclaimer: The views and analysis presented in this article are for informational purposes only and reflect the author’s perspective, not financial advice. Technical patterns and indicators discussed are subject to market volatility and may or may not yield the anticipated results. Investors are advised to exercise caution, conduct independent research, and make decisions aligned with their individual risk tolerance.
Also Read: PUMP Rallies with Revenue-Generating Tokens Gain Momentum — +25% Upside Ahead?