MUSHROOM Price Prediction 2026: Quick Outlook MUSHROOM (SHROOM) price prediction 2026 starts with a plain fact: this token is barely 3 weeks old. Anyone searching for a reliable SHROOM price
MUSHROOM Price Prediction 2026: Quick Outlook
MUSHROOM (SHROOM) price prediction 2026 starts with a plain fact: this token is barely 3 weeks old. Anyone searching for a reliable SHROOM price prediction should treat it differently than an asset with years of trading history behind it.
At the time of writing, SHROOM trades near $0.02088, up more than 50% on the day. That kind of swing is normal for a coin this young.
For traders comparing this launch against other early-stage projects, the crypto presale and ICO listings page tracks similar new tokens before they reach major exchanges.
Data below comes from CoinGecko, GeckoTerminal, and RobinScan, as of September 23, 2026, 14:00 UTC.
SHROOM Prediction Snapshot
Metric
Current Data
Current Price
$0.02088
24H Change
+55.2%
Market Cap
$20.59M
24H Volume
$4.91M
Trend
Bullish, short-term
RSI (1H)
61.94
Immediate Support
$0.01452
Immediate Resistance
$0.02479
Next Target
$0.05891
Bull Case
$0.03500 – $0.06000
Base Case
$0.01800 – $0.02800
Bear Case
$0.00900 – $0.01400
Invalidation
Trades below $0.01102
What Is MUSHROOM (SHROOM)?
SHROOM is the native token behind MUSHROOM, a project built around liquidity for stock-paired tokens. It runs on Robinhood Chain, an ERC-20-compatible network tied to Robinhood's on-chain trading ecosystem.
CertiK's project notes describe MUSHROOM as a liquidity infrastructure protocol for stock tokens operating on Robinhood Chain. That's a mouthful, but the idea is simple: it helps pools stay liquid when people trade tokenized stocks.
The project runs at shroomnetwork and is launched through the Pons launchpad at ponsfamily.
SHROOM went live roughly 19 days ago. Total supply sits near 999,997,458 tokens, with a hard max of 1 billion. Circulating supply is already close to that ceiling, around 985.8 million tokens.
Here's the thing: with the full supply nearly unlocked already, dilution risk from future unlocks looks limited compared to projects that release tokens in stages.
Readers tracking similar new launches beyond SHROOM can browse the crypto news section for ongoing coverage of meme and stock-paired token projects.
SHROOM Price Analysis: What Is Driving the Trend?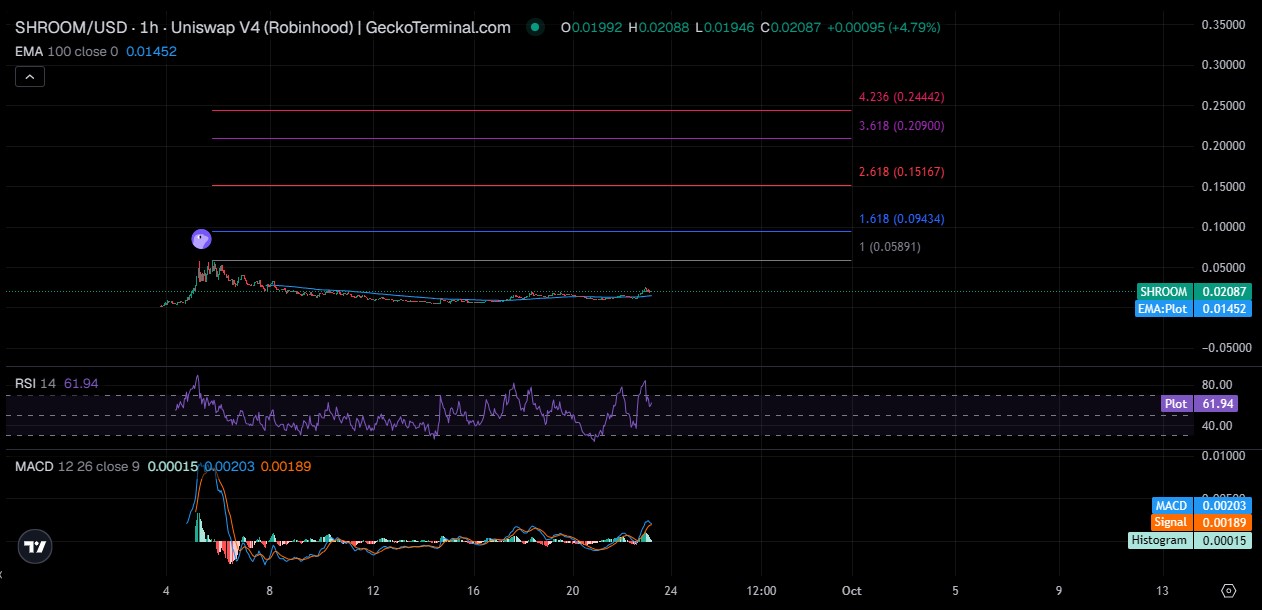
Recent Price Action
SHROOM launched with extreme volatility, the kind every new Robinhood Chain token seems to share. It spiked to an all-time high of $0.05825, then fell hard.
The price sits about 64.5% below that high today. And it's climbed 424.9% above its all-time low of $0.003941, set shortly after launch.
The 7-day range runs from $0.006135 to $0.02479. That's a wide band for one week. Structure has firmed up lately, though, with trades grinding sideways above the 100-period moving average on the hourly chart.
Trading Volume and Liquidity
24-hour volume on CoinGecko reads $4.91M against a $20.59M market cap. That ratio, roughly 24%, suggests real turnover rather than a dead chart.
On-chain liquidity, tracked separately through GeckoTerminal's pool data, shows a much thinner pocket, around $24K in the primary Uniswap V4 pool on Robinhood Chain. That gap between aggregate volume and single-pool liquidity matters.
RSI and Momentum
When we pulled up the RSI on the 1-hour chart, the first thing that stood out was a reading of 61.94, firmly on the bullish side of neutral without flashing overbought.
MACD sits at 0.00203, above its signal line at 0.00189, with a positive histogram of 0.00015. That's a mild bullish crossover, not a dramatic one.
Moving averages back this up loosely. The 100-period EMA on the hourly chart reads $0.01452, well below trades, which keeps the broader trend tilted up. But momentum here is thin, and thin momentum breaks easily.
MUSHROOM Support and Resistance Levels
Key Support
Immediate support sits at $0.01452, matching the 100-period EMA on the hourly chart. This zone has acted as a floor during recent pullbacks.
A secondary support band runs near $0.01102, the 24-hour low. Losing this level would undo most of the week's recovery.
Key Resistance
Resistance sits at $0.02479, the top of both the 24-hour and 7-day ranges. Trades have tested this zone without a clean push-through.
Beyond that, Fibonacci extension mapping from the recent swing points to $0.05891 as the next major ceiling, followed by $0.09434.
Breakout Confirmation
A break above $0.02479 alone won't confirm much. What matters is trades holding above that level on rising volume, with multiple hourly closes confirming the move rather than one wick.
Without that, a breakout above $0.02479 risks turning into a fakeout fast.
Breakdown Risk
A drop below $0.01452 would flip short-term structure bearish. A further slide under $0.01102 would invalidate the recovery entirely and open the door toward the all-time low zone.
MUSHROOM Price Prediction Scenarios
Bull Case
The bull case needs a real catalyst: new exchange listings, deeper liquidity pools, or fresh stock-token pairs launching against SHROOM.
Technical confirmation would come from sustained trades above $0.02479 with rising volume. Target zone: $0.035 to $0.06. Invalidation: a close back below $0.018.
Base Case
The base case assumes consolidation. Trades range between support and resistance while liquidity slowly deepens and holder count grows.
Target zone: $0.018 to $0.028. Invalidation: a decisive break of either boundary on volume.
Bear Case
The bear case starts with support failure at $0.01452, followed by thinning liquidity as early holders exit.
Downside zone: $0.009 to $0.014. Invalidation for bears: a reclaim of $0.018 with volume backing it.
MUSHROOM Price Prediction 2026-2030
Year
Bear Case
Base Case
Bull Case
Main Driver
2026
$0.006 – $0.012
$0.015 – $0.028
$0.035 – $0.06
Liquidity depth and launch structure
2027
$0.01 – $0.02
$0.02 – $0.045
$0.06 – $0.10
Adoption and market cycle
2028
$0.012 – $0.025
$0.03 – $0.06
$0.09 – $0.15
Ecosystem growth
2029
$0.015 – $0.03
$0.04 – $0.08
$0.12 – $0.20
Liquidity plus broader market
2030
$0.018 – $0.035
$0.05 – $0.10
$0.15 – $0.24
Network utility and market conditions
Because SHROOM has such a short trading history, a market-cap and scenario-based method is more defensible than pretending a model can name an exact 2030 price. Nobody knows that. Anyone claiming otherwise isn't being straight with you.
For scenario-based forecasts on other assets, the price prediction hub collects similar year-by-year breakdowns across the market.
What Could Drive SHROOM Higher?
Stock-Token Liquidity Growth
More liquidity flowing into stock-paired pools would directly support SHROOM's utility case, since the protocol's whole pitch centers on that liquidity layer.
New Liquidity Pools
Recent posts from the project's official account show new pairs forming, including a pool against $ORBIO through the Pons launchpad, announced September 19.
Holders watching for incentive programs tied to new pool launches can track ongoing distributions on the crypto airdrops page.
Exchange Listings
Project data referenced by CertiK notes recent listings on Poloniex and Ourbit. More centralized exchange access tends to widen the buyer base.
Traders watching for the next listing can check theexchange listing tracker for updates across the market.
Treasury Activity
The project announced its Meridian Genesis farming period opened on September 21, letting holders deposit SHROOM for yield. Programs like that can reduce circulating float temporarily.
Dates for programs like this, along with other unlock and reward events, sit on thecoin events calendar.
Broader Crypto Market Strength
A rising tide in the wider crypto market lifts new, thinly traded tokens faster than it lifts established ones. And it drops them faster too.
Some of that broader momentum now ties back to AI-driven trading tools and automated market makers; the AI-related crypto news section covers that angle in more depth.
What Could Push SHROOM Lower?
Liquidity Risk
Thin on-chain liquidity, sitting around $24K in the primary pool, means large trades can swing price sharply in either direction.
Early-Stage Volatility
Tokens under a month old don't behave like mature assets. Wide daily ranges, sometimes over 50%, should be expected, not treated as unusual.
Whale Selling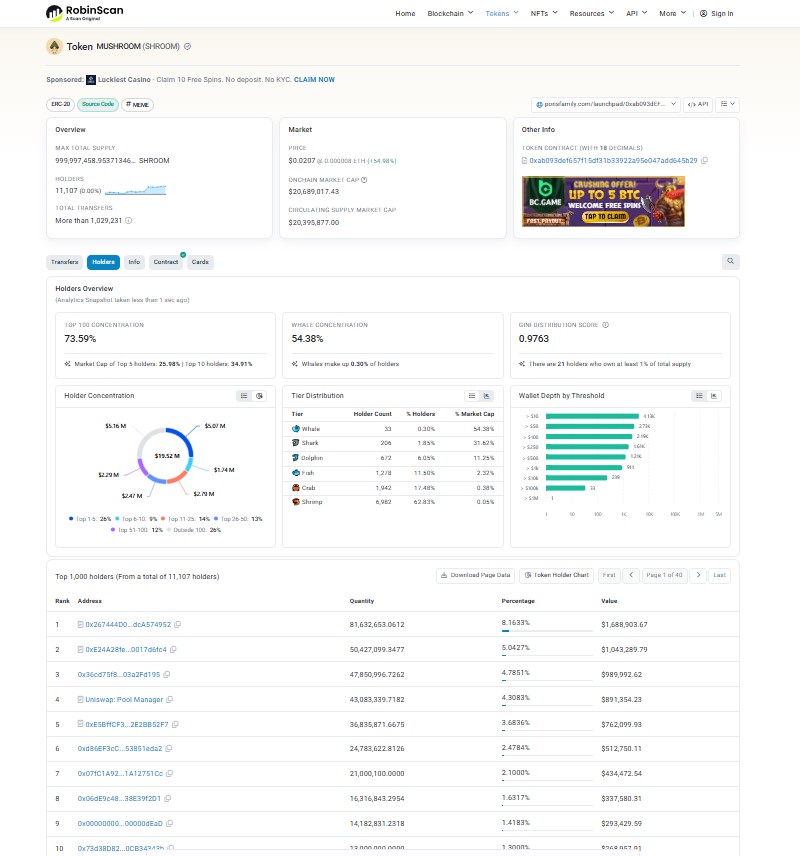
RobinScan's holder data shows the top 10 wallets control 34.91% of supply, and whale-tier wallets account for 54.38% of holders' combined balance. Concentrated ownership raises sell-pressure risk if large holders exit together.
Loss of Key Support
A break below $0.01452, and then $0.01102, would signal the recovery has failed and reopen the path toward earlier lows.
Broader Crypto Weakness
A downturn across major crypto assets tends to hit small-cap, newly launched tokens hardest. SHROOM wouldn't be an exception.
Token Supply and Data Uncertainty
With limited history, on-chain data providers sometimes show conflicting numbers for volume and holder counts. Cross-check figures across RobinScan and GeckoTerminal before acting on any single source.
Breaking: as of this writing, SHROOM continues trading within its recent range. No confirmed breakout yet. Volume remains active. Holders keep growing, now past 11,100 wallets. Nothing decisive has happened. Watch the $0.02479 line.
That's the setup.
Disclaimer
This article is for informational purposes only and does not constitute financial, investment, or trading advice. Cryptocurrency markets, especially newly launched tokens like SHROOM, carry high volatility and liquidity risk. Prices and figures reflect data available as of September 23, 2026, 14:00 UTC, and can change quickly. Readers should conduct independent research and consult a qualified financial advisor before making any investment decisions.