TLDR SOL is currently trading around $121, maintaining support above its 20, 50, 100 and 200-day exponential moving averages. Both daily and weekly timeframes identify $125 as critical resist
TLDR
- SOL is currently trading around $121, maintaining support above its 20, 50, 100 and 200-day exponential moving averages.
- Both daily and weekly timeframes identify $125 as critical resistance that could determine the next directional move.
- Chaikin Money Flow on the daily chart registers 0.23, indicating consistent accumulation.
- Total value locked in Solana’s DeFi ecosystem increased from approximately $5.6 billion to $6.7 billion during the September-October period.
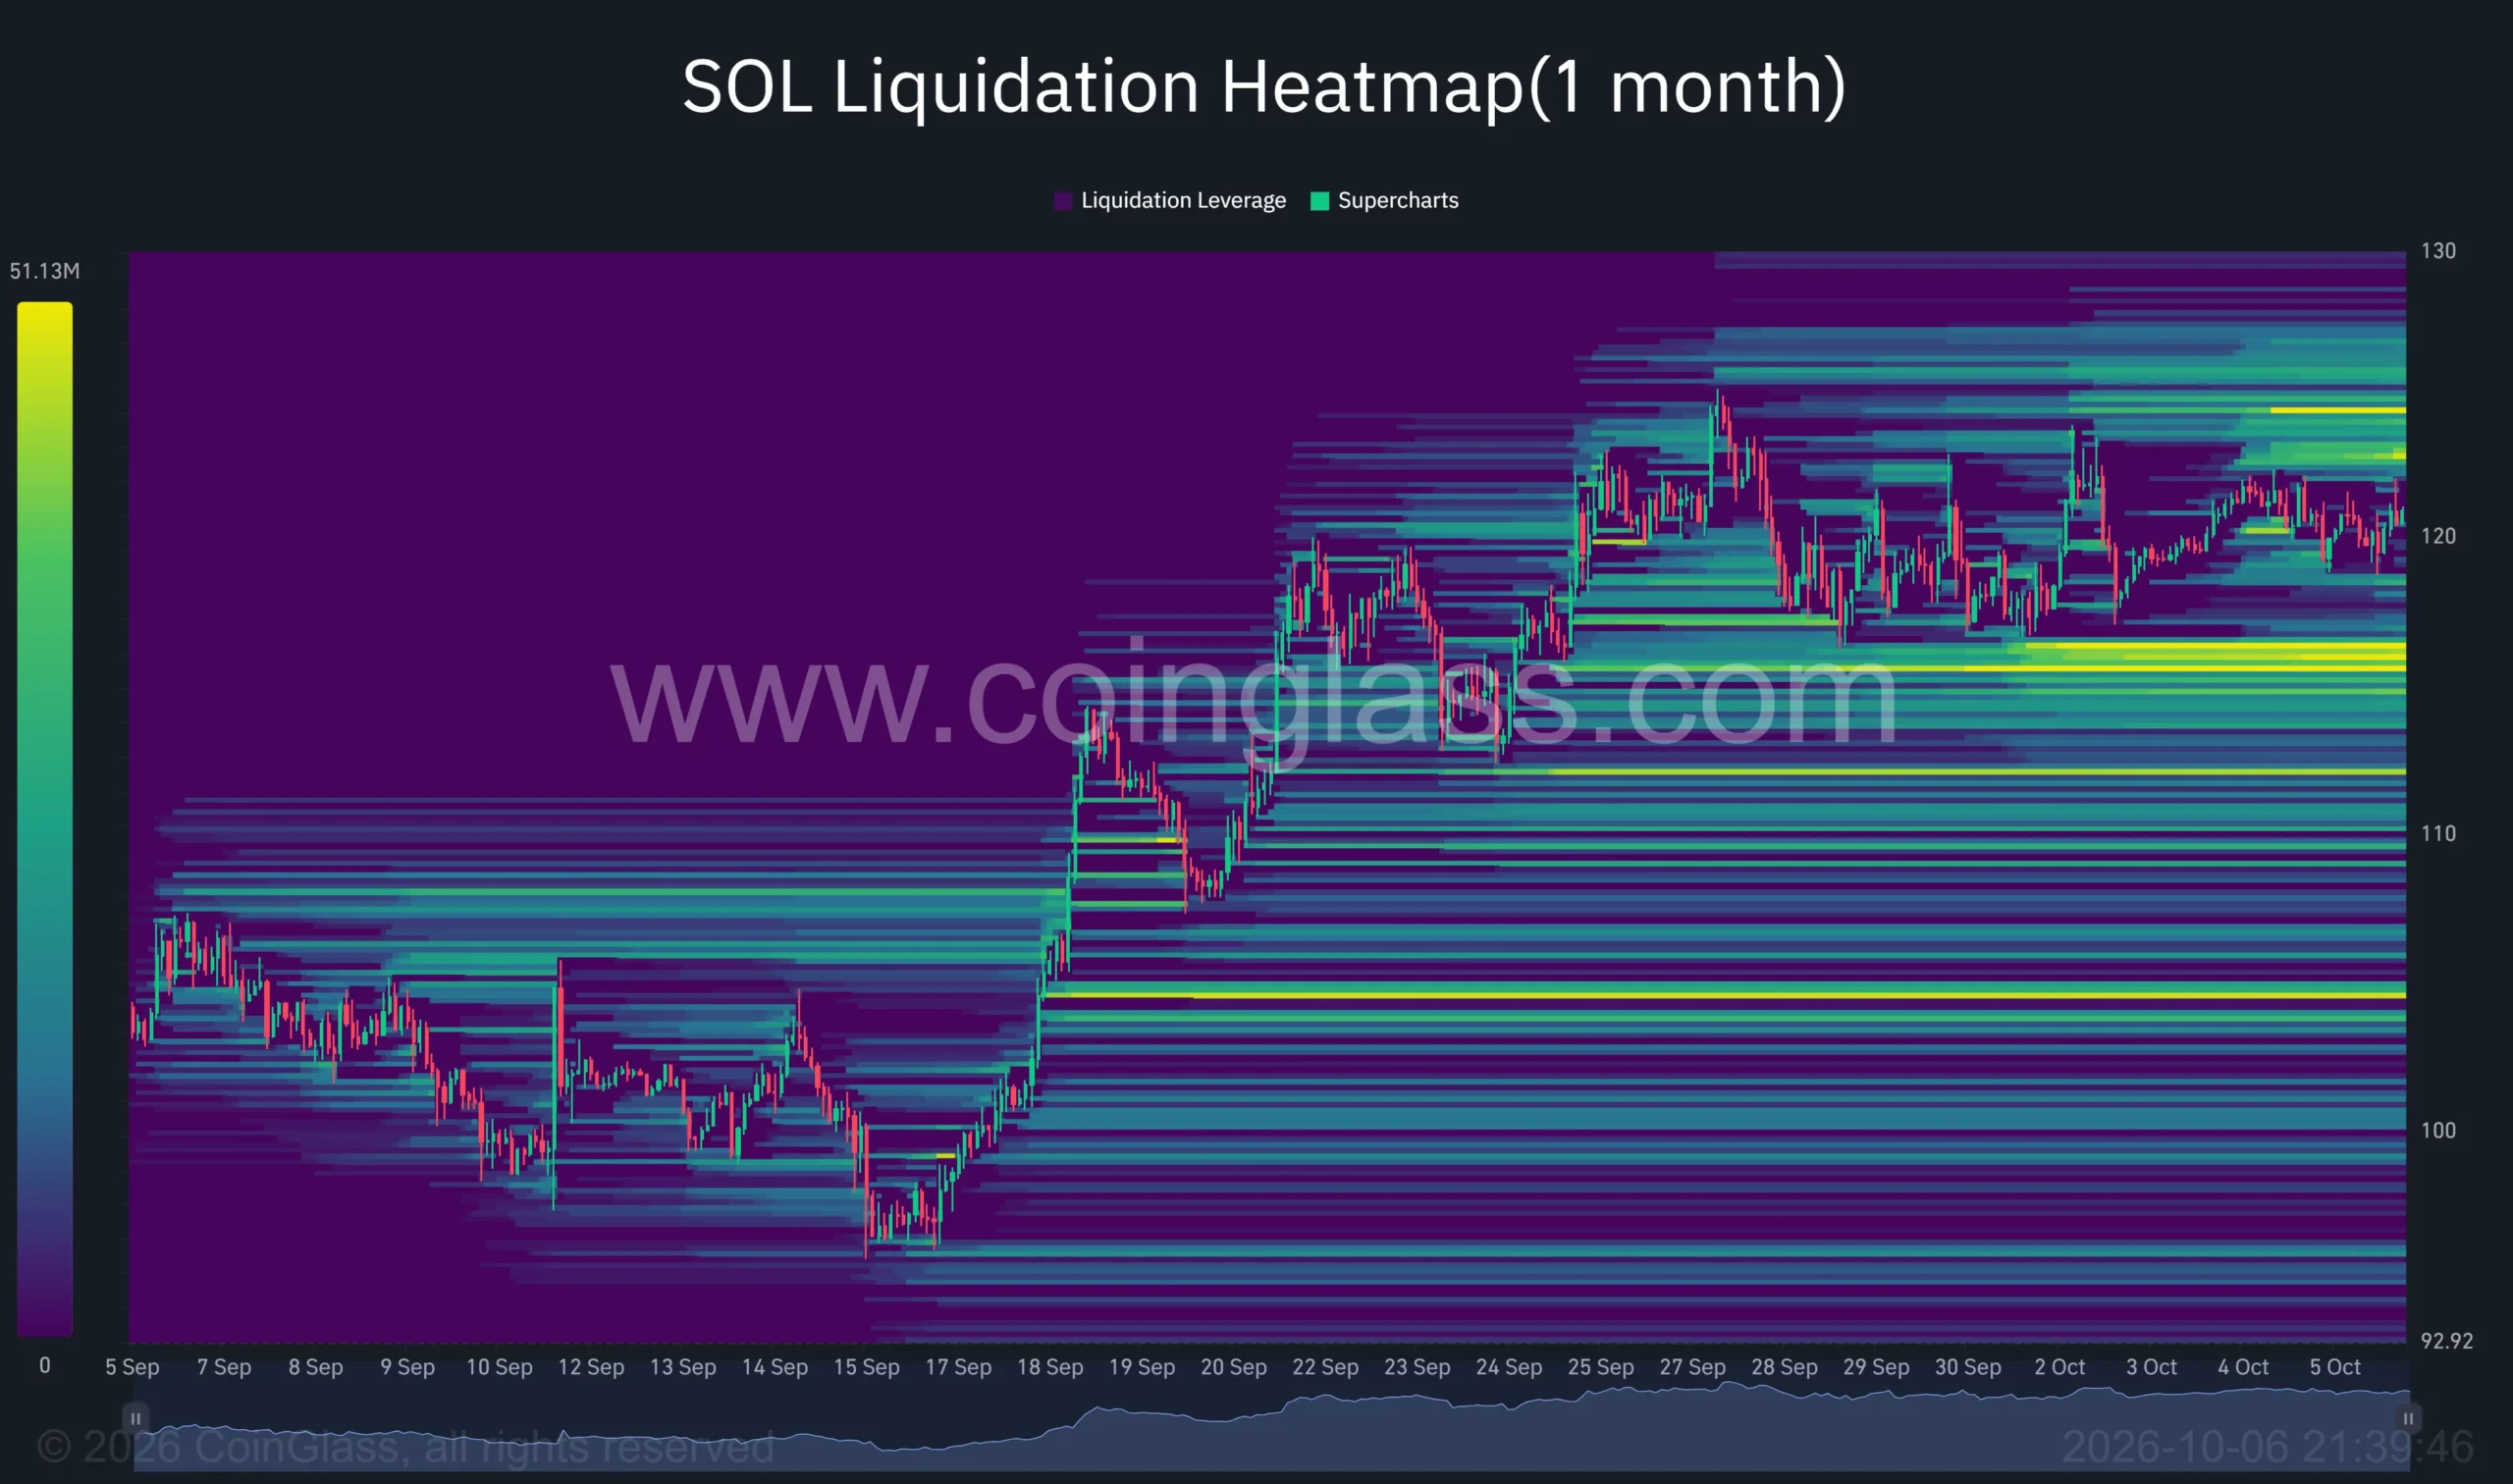
- Derivatives open interest has surged past $7 billion, with significant liquidation zones concentrated around $115 and $125.
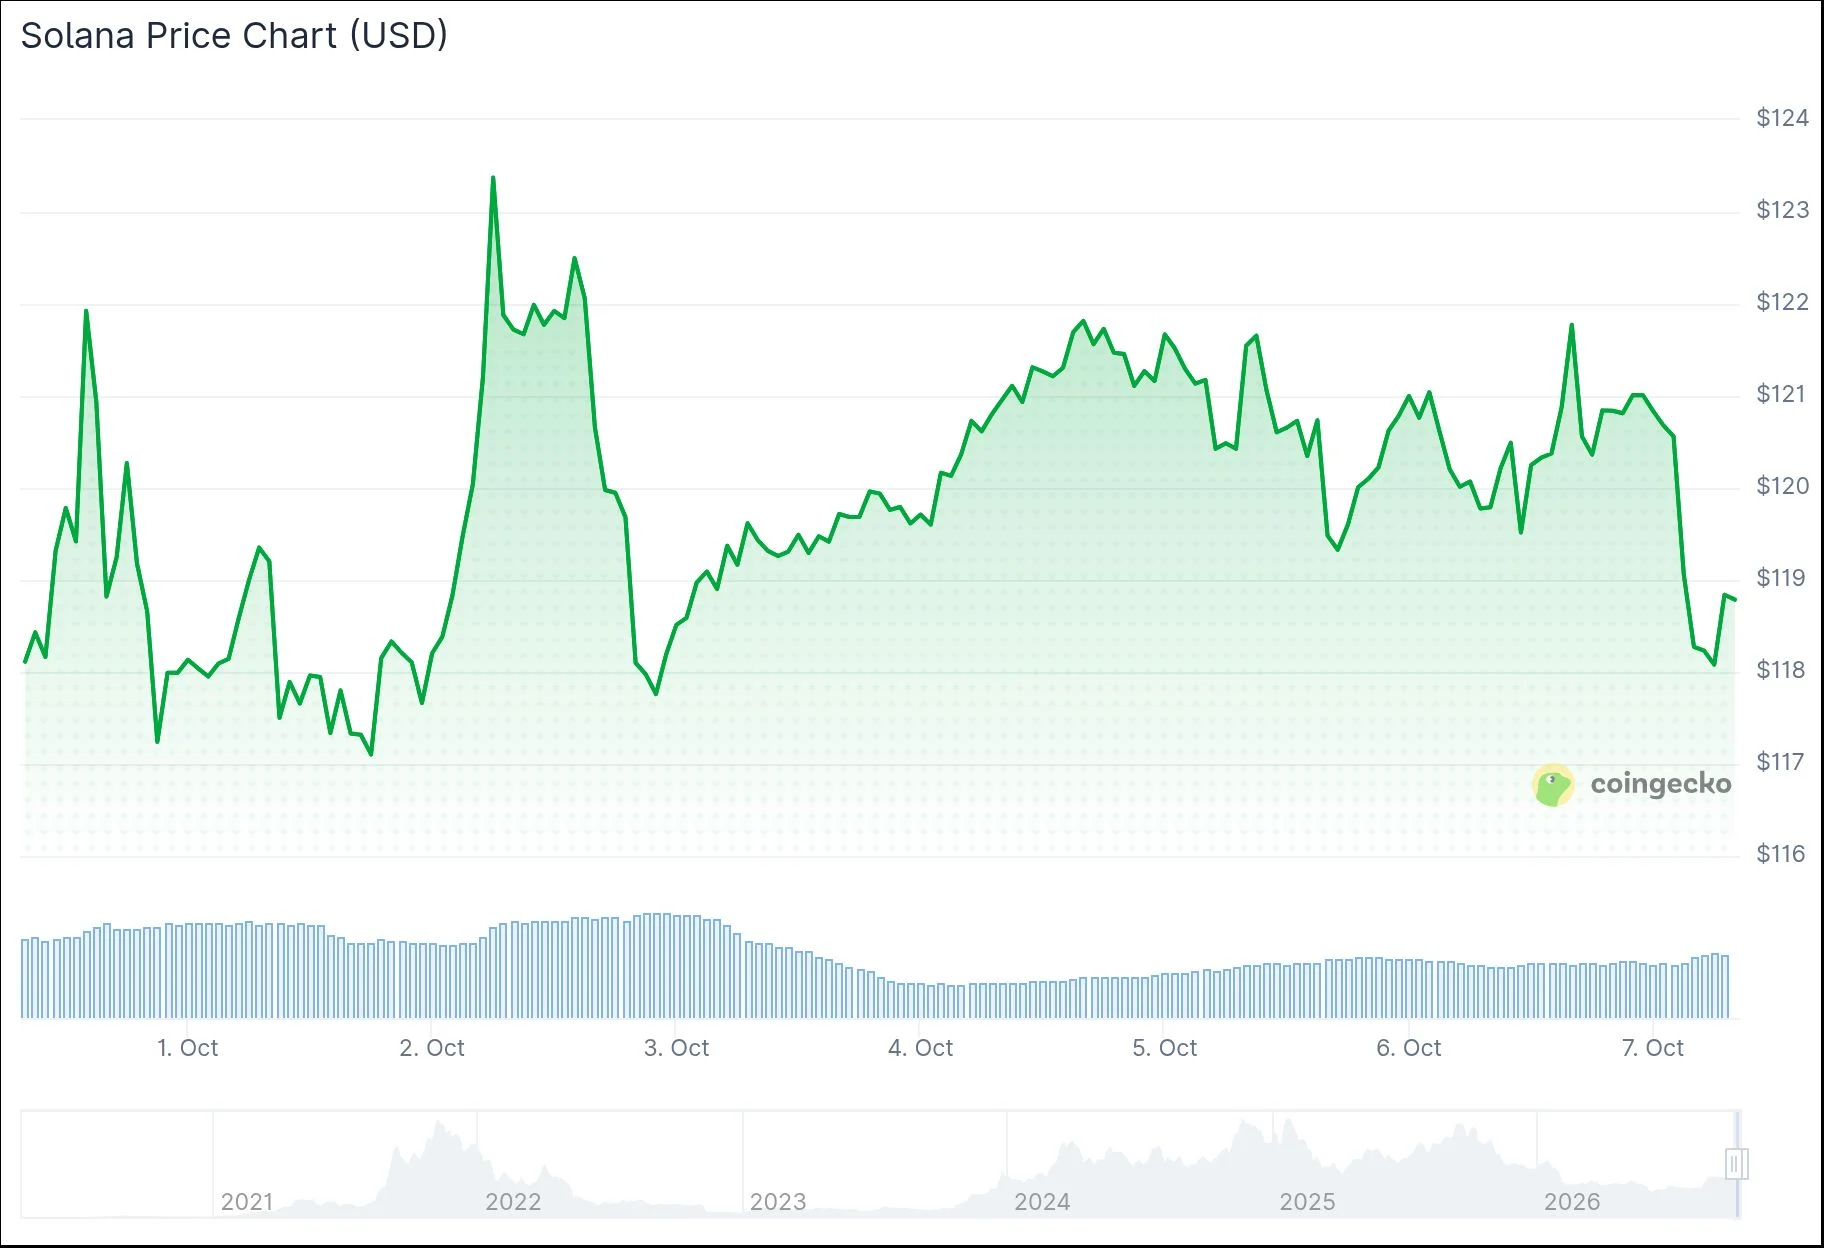
Solana was changing hands at $121.44 as of Oct. 6, registering a modest 0.55% gain in the preceding 24-hour period. The digital asset has been range-bound for multiple trading sessions following a strong rebound in September.
 Solana (SOL) Price
Daily price action saw SOL reach an intraday peak of $122 before pulling back to a low of $118.88. This tight corridor has persisted for several days, with the late-September high establishing the immediate price ceiling.
From current levels, SOL remains approximately 3.5% beneath the $125 threshold highlighted on weekly charts. Reaching $150 would necessitate a rally of roughly 24% from present valuations.
Daily technical indicators show SOL maintaining a position above its 20-day EMA at $116.39 and 50-day EMA at $106.76. The longer-term 100-day and 200-day EMAs are positioned further below at $97.77 and $96.60 respectively.
Weekly Chart Highlights $125 as Critical Decision Point
Analysis of the weekly TradingView chart identifies $125 as the primary pivot point according to the Murrey Math indicator. SOL was quoted at $120.77 on the weekly timeframe, hovering just beneath this crucial level.
The subsequent Murrey Math resistance is located at $156.25, representing the upper boundary of the established trading channel. On the downside, the corresponding support floor stands at $93.75.
The weekly Average Directional Index registered 30.21. This metric quantifies trend intensity rather than trajectory, providing no inherent bullish or bearish signal for October.
Market analyst Wealthmanager observed on X that SOL appears to be forming a contracting triangle pattern, characterized by descending highs and ascending lows compressing the trading range. The analyst noted that while no breakout has materialized, the setup suggests a significant move may be approaching.
DeFi Metrics and Derivatives Interest Show Sustained Growth
DeFiLlama statistics reveal that total value locked across Solana’s DeFi protocols expanded from approximately $5.6 billion in early September to roughly $6.7 billion by early October. Decentralized exchange volumes and active wallet counts remained robust throughout this interval.
According to CoinGlass tracking, Solana’s aggregate open interest in derivatives markets has pushed above the $7 billion threshold during this timeframe. Both long and short positions have experienced liquidations as SOL fluctuates near the $121 mark.
The one-month liquidation heatmap from CoinGlass reveals concentration zones between $115 and $116 beneath current pricing. Additional liquidation bands are visible near $112 and within the $104 to $105 range.
Source: Coinglass
On the upside, the heatmap displays notable clusters between $123 and $125, with further accumulation near $126 to $127. These zones align closely with the weekly $125 pivot level.
The daily Supertrend indicator continues to flash green at $107.22, sitting approximately 11.3% below current market price. SOL has maintained its position above this dynamic support throughout recent consolidation.
Technical charts mark $113.05 as the primary support threshold on daily timeframes. A breakdown below this level could redirect attention toward the lower exponential moving averages.
Network performance metrics have also shown improvement. The Solana Foundation disclosed that mainnet slot times achieved 250 milliseconds on Sep. 18, with a planned reduction to 200 milliseconds targeted for epoch 1052.
The post Narrowing Triangle Pattern Points to Imminent Price Move for Solana (SOL) appeared first on Blockonomi.