NEAR price has slipped below $5 after a rejection at $6, putting near-term support under pressure while analyst Giannis Andreou keeps a conditional recovery toward $16 in view. Summary NEAR p
NEAR price has slipped below $5 after a rejection at $6, putting near-term support under pressure while analyst Giannis Andreou keeps a conditional recovery toward $16 in view.
Summary
- NEAR price traded near $4.97, roughly 17% below the $6 high shown on TradingView.
- Daily MACD turned negative, with price slightly below the 20-day simple moving average.
- Weekly Supertrend remained bullish at $2.95, while the Awesome Oscillator stayed above zero.
- Andreou identified $4.50 as a key floor and $6 as the weekly breakout threshold.
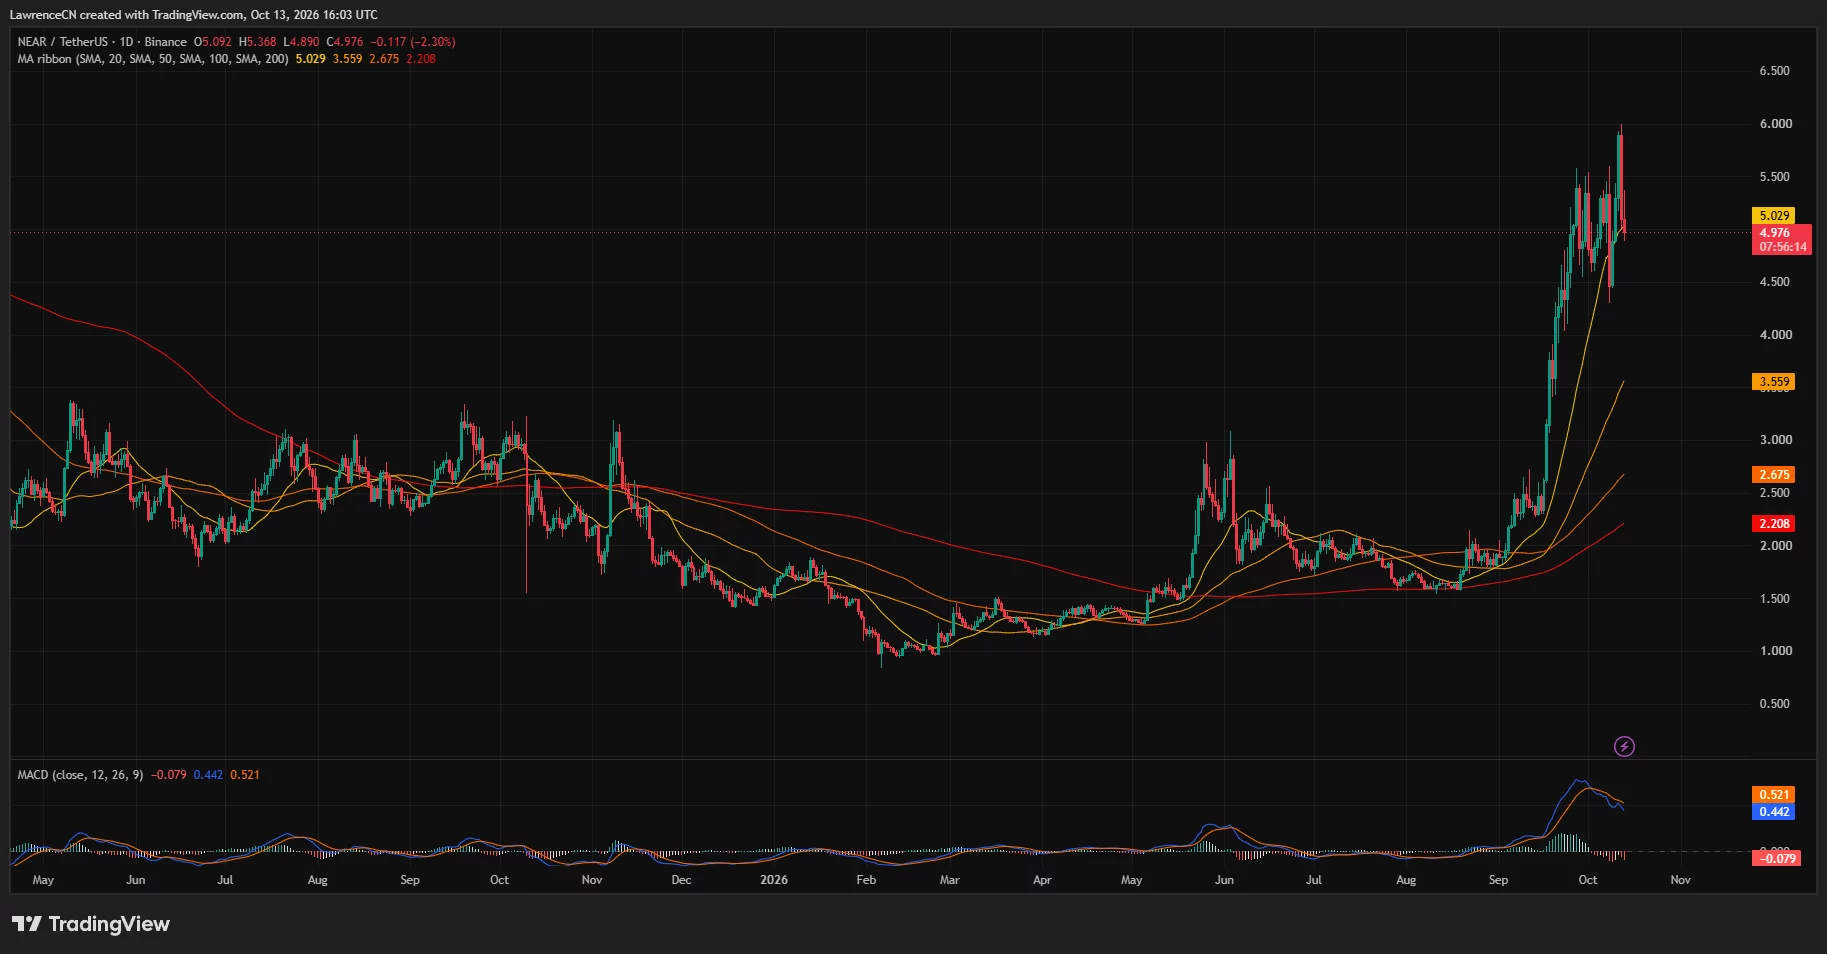
TradingView’s Binance NEAR/USDT daily chart showed the token at $4.976 on Oct. 13, down 2.30% for the session. The daily trading range extended from $4.89 to $5.368, leaving the price below both the session opening level and its 20-day simple moving average.
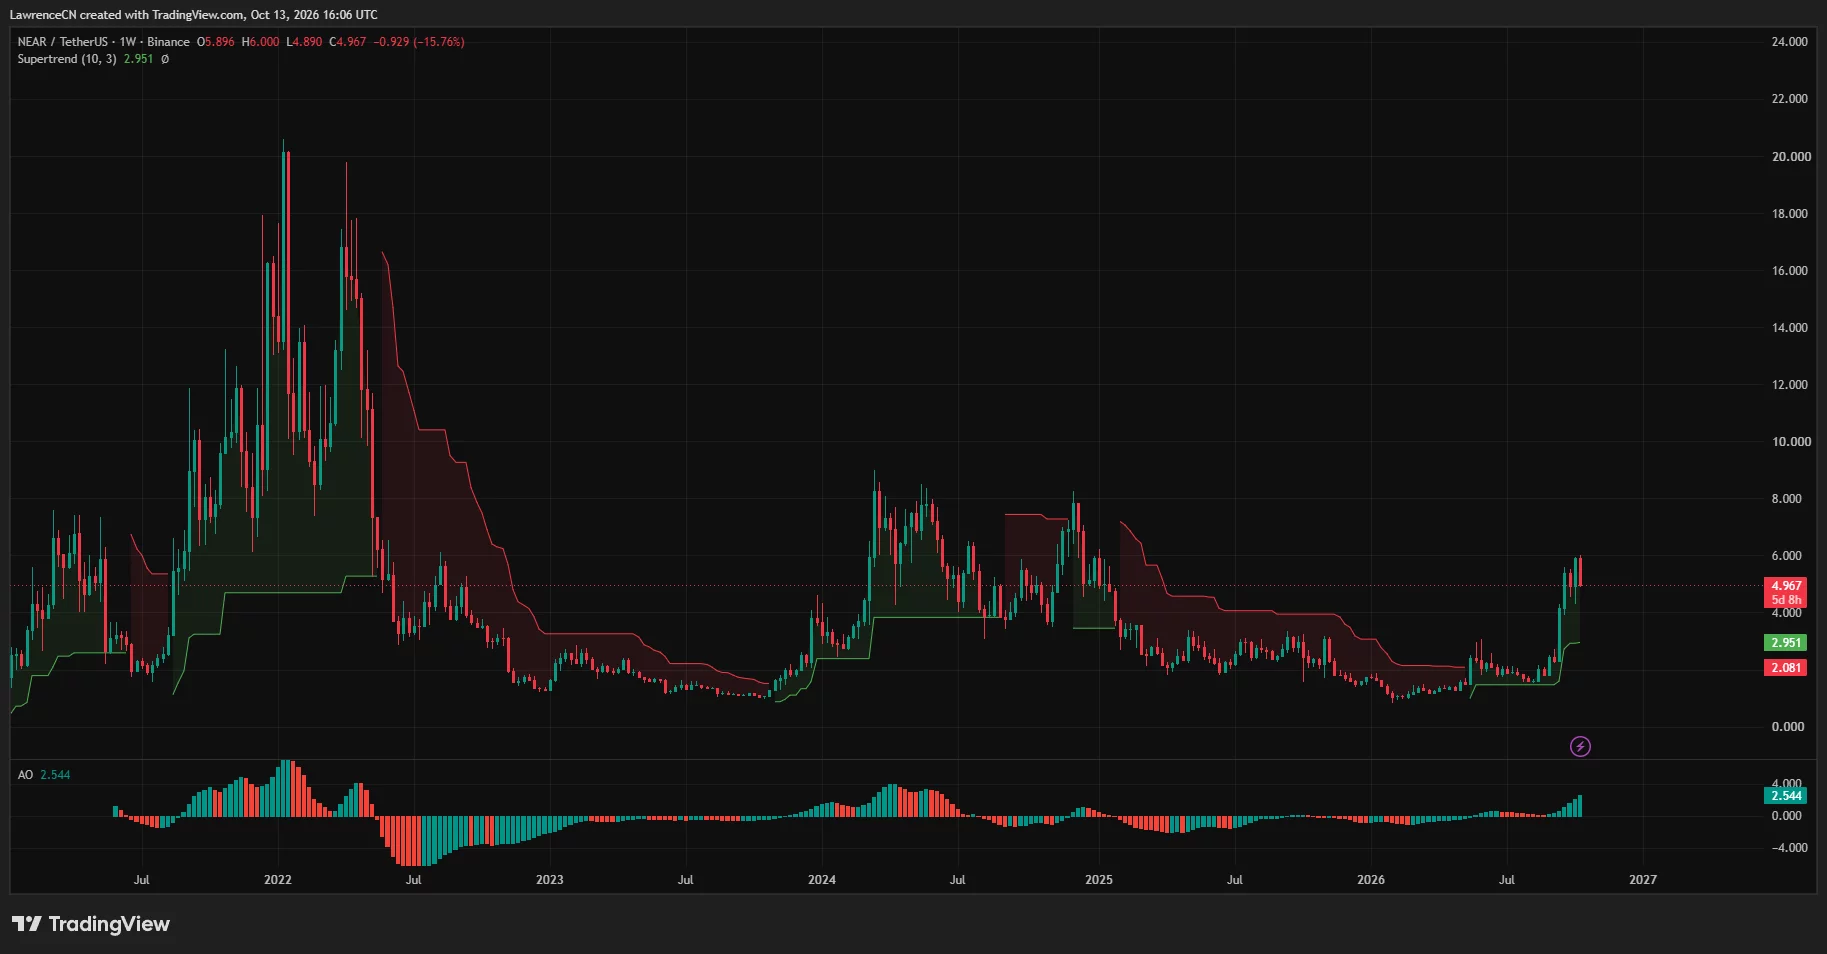
The weekly chart placed NEAR at $4.967, down 15.76% from the weekly opening price of $5.896. A move to $6 preceded the retreat, while the week’s low stood at $4.89.
NEAR’s pullback follows a steep September advance visible on the daily chart, when the token climbed from the low-$2 range into a trading band above $4. The latest decline has brought the price back toward $5 after several swings between roughly $4.30 and $6.
You might also like: NEAR price nears $6 with $1.95B in open bets: What’s next?
NEAR loses its 20-day average as daily momentum weakens
TradingView placed NEAR’s 20-day simple moving average at $5.029, just above the market price. The gap was about 1%, making the short-term average a nearby level for any recovery attempt.
NEAR price daily chart — Oct. 13 | Source: TradingView
The longer daily averages remained below NEAR’s price. The 50-day average stood at $3.559, followed by the 100-day average at $2.675 and the 200-day average at $2.208.
The daily moving-average arrangement therefore remained upward, with the shorter averages above the longer ones. However, NEAR’s retreat below the 20-day average coincided with a weaker MACD reading.
The daily MACD line stood at 0.442, below its signal line at 0.521. The histogram measured minus 0.079, with red bars appearing after the strong positive readings that accompanied September’s rally.
Together, the daily chart readings show a loss of short-term upward momentum while the price remains well above the longer moving averages. A recovery above $5.03 would reclaim the nearest average, but NEAR would still face the session high around $5.37 and the recent peak at $6.
On the downside, the daily low of $4.89 marks the nearest observed price reference. Below that, Andreou’s $4.50 threshold becomes relevant to his broader recovery scenario.
Analyst’s $16 scenario depends on a weekly break above $6
In an Oct. 13 X post, analyst Giannis Andreou described $6 as NEAR’s next major test. He identified a support zone between $4.50 and $5.30 following the token’s advance above its earlier base.
“NEAR’S NEXT BIG TEST IS $6”
Andreou said a confirmed weekly breakout above $6 would also clear the 0.618 Fibonacci level near $5.83 and bring resistance at $8.809 into focus.
His next extension level sat near $10.93. Beyond that, his illustrated recovery path reached toward $16, close to a projected upper trendline.
The analyst calculated approximately 195% upside to $16 from a reference price of $5.428. That percentage belongs to his stated starting price, which was above the roughly $4.97 reading on the later Binance charts.
Andreou made the recovery path conditional on successful retests and higher lows. He also outlined a downside sequence: losing $4.50 would put $3.98 in focus before the earlier $2–$3 base.
At the latest chart price, NEAR was inside the support range he identified, but below its $5.30 upper boundary. His bullish scenario therefore still required a recovery through that zone and a confirmed weekly move above $6.
Weekly indicators remain bullish despite the retreat
TradingView’s weekly chart showed a green Supertrend reading at $2.951, well below NEAR’s market price. The indicator had switched from the earlier red resistance line as the token advanced out of its prior trading range.
NEAR price weekly chart — Oct. 13 | Source: TradingView
The weekly Awesome Oscillator stood at a positive 2.544. Its latest visible bars were green, following the sharp rise in weekly prices during September and early October.
The weekly indicators contrast with the bearish crossover on the daily MACD. The weekly chart retained positive trend readings while the daily chart recorded weakening momentum during the pullback.
The distance to weekly Supertrend also separates the immediate price test from the longer-term indicator level. Andreou’s $4.50 support threshold sits much closer to the market than the $2.95 Supertrend reading.
A second chart shared by Team LAMBO Charts marked a demand zone around $4.40–$4.60, broadly overlapping Andreou’s lower support boundary. It also showed lower zones near $3.40–$3.60 and $2.20–$2.40.
Liquidation bands cluster below $5 and above $5.70
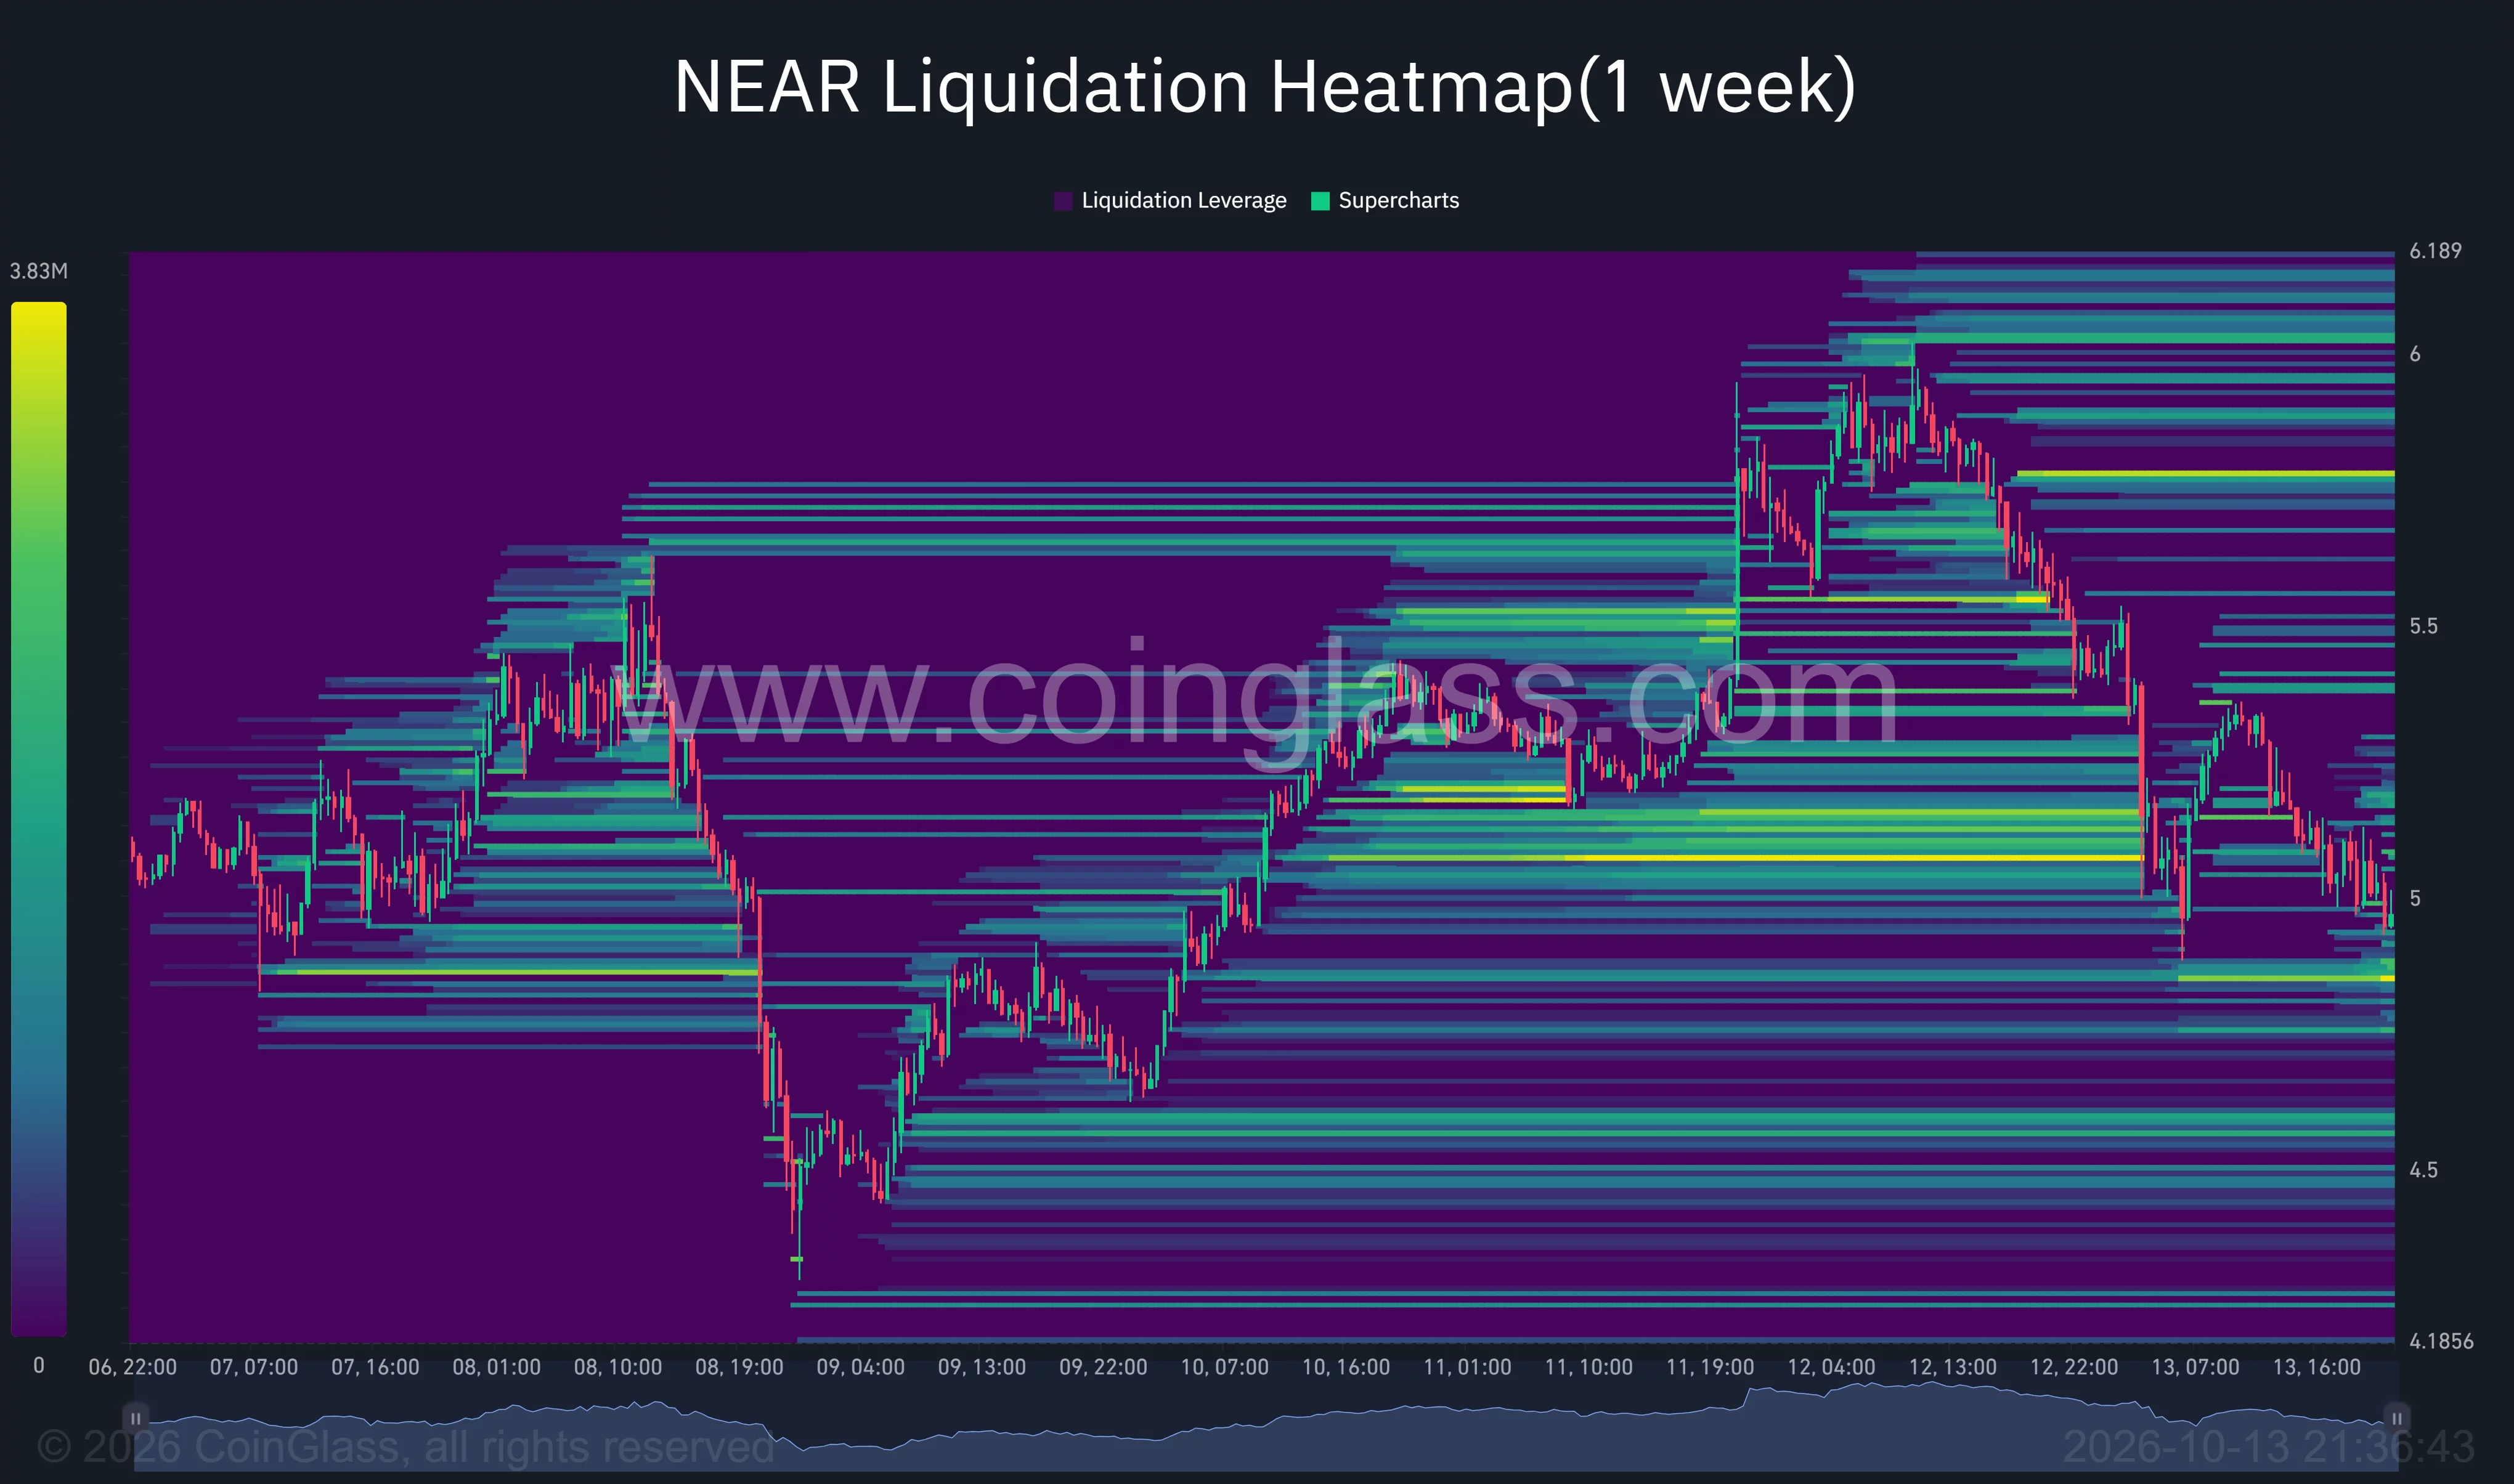
CoinGlass’s one-week liquidation heatmap showed NEAR retreating toward $5 after trading near $6. Bright estimated liquidation bands remained around $4.85–$4.90, immediately below the latest price.
NEAR liquidation heatmap | Source:
CoinGlass
Additional bands appeared around $4.50–$4.60, overlapping the lower support area identified in the analyst charts. Above the market, visible clusters sat around $5.10, $5.50–$5.55, and roughly $5.75–$5.80.
For U.S. holders following the dollar-denominated price, the Binance chart and CoinGlass heatmap place the immediate contest around $4.90–$5.03. That range contains the latest daily low and the 20-day moving average.
A move above $5.03 would reclaim the short-term average, while $5.30–$5.37 remains the next nearby recovery area. Andreou’s larger upside case requires a weekly breakout above $6; a loss of $4.50 would instead activate the next downside checkpoint in his analysis at $3.98.
Disclosure: This article does not represent investment advice. The content and materials featured on this page are for educational purposes only.
Read more: Chainlink price falls 18% despite bullish $19.50 call: Can LINK recover?