Can a coin that jumped 24.58% in a day keep climbing, or is $0.2551 already the ceiling? This Nesa price prediction starts at $0.2308 on CoinMarketCap, right after NES broke out of a rising c
Can a coin that jumped 24.58% in a day keep climbing, or is $0.2551 already the ceiling?
This Nesa price prediction starts at $0.2308 on CoinMarketCap, right after NES broke out of a rising channel on the 4H chart. Launch history lives in theNesa airdrop launch coverage.
NES Data Snapshot on Nov 18, 2026, 09:03 UTC
NES is up 24.58%. The price sits at $0.2308, ranking 283rd on theCoinMarketCap price page.
Volume hit $13.52M, or 19.73% of the $68.91M market cap. Heavy for a coin this size.
Circulating supply is 298.56M NES out of 1.03B. The 24h range ran $0.1835 to $0.2505, and June's high of $0.3595 is 35.77% away.
Project Post and the Enterprise AI Pitch
Nesa's X post on Deloitte cites a State of AI 2026 survey of 3,235 leaders. 73% name data privacy and security as their top AI risk, and only 21% report mature governance for agents.
That's a story, not a dated catalyst. No listing or partnership backs the 24h move, so the NES price forecast leans on levels and flows.
What Futures Data Says About Direction
CoinGlass futures data shows open interest, the total value of open futures positions, at $4.73M, up 21.86%.
Futures volume hit $15.76M against $3.44M in spot. Which is a lot for a coin this size.
The funding rate, a fee that longs and shorts pay each other, sits at 0.0070%. Traders aren't overpaying to stay long.
Short liquidations and forced exits of bearish bets made up $46.92K of $54.21K in 24 hours. At first that looked like a squeeze already finished. Scratch that. Open interest kept growing after the flush.
But spot net flow is negative $26.9K, while futures show positive $393.4K. Futures traders are driving this.
Holder Concentration and Supply Risk
Etherscan holder data lists 11,659 holders, and the top wallet holds 57.17% of tracked supply.
Holder concentration is extreme. The top 5 wallets control about 95%.
So who absorbs the selling if a top wallet decides to move?
And most big wallets carry no label, so nobody can say if they're vesting contracts or early investors.
Token Allocation and Supply Release
TheNesa whitepaper allocation gives investors 14.62%, the team 10%, and core contributors 10%, a combined 34.62%.
But day-1 supply was only 14.15%. Vesting dates for the rest matter more than any chart line, since fresh supply at RSI 77 is a classic reason rallies stall.
Nesa Price Prediction From the 4-H Chart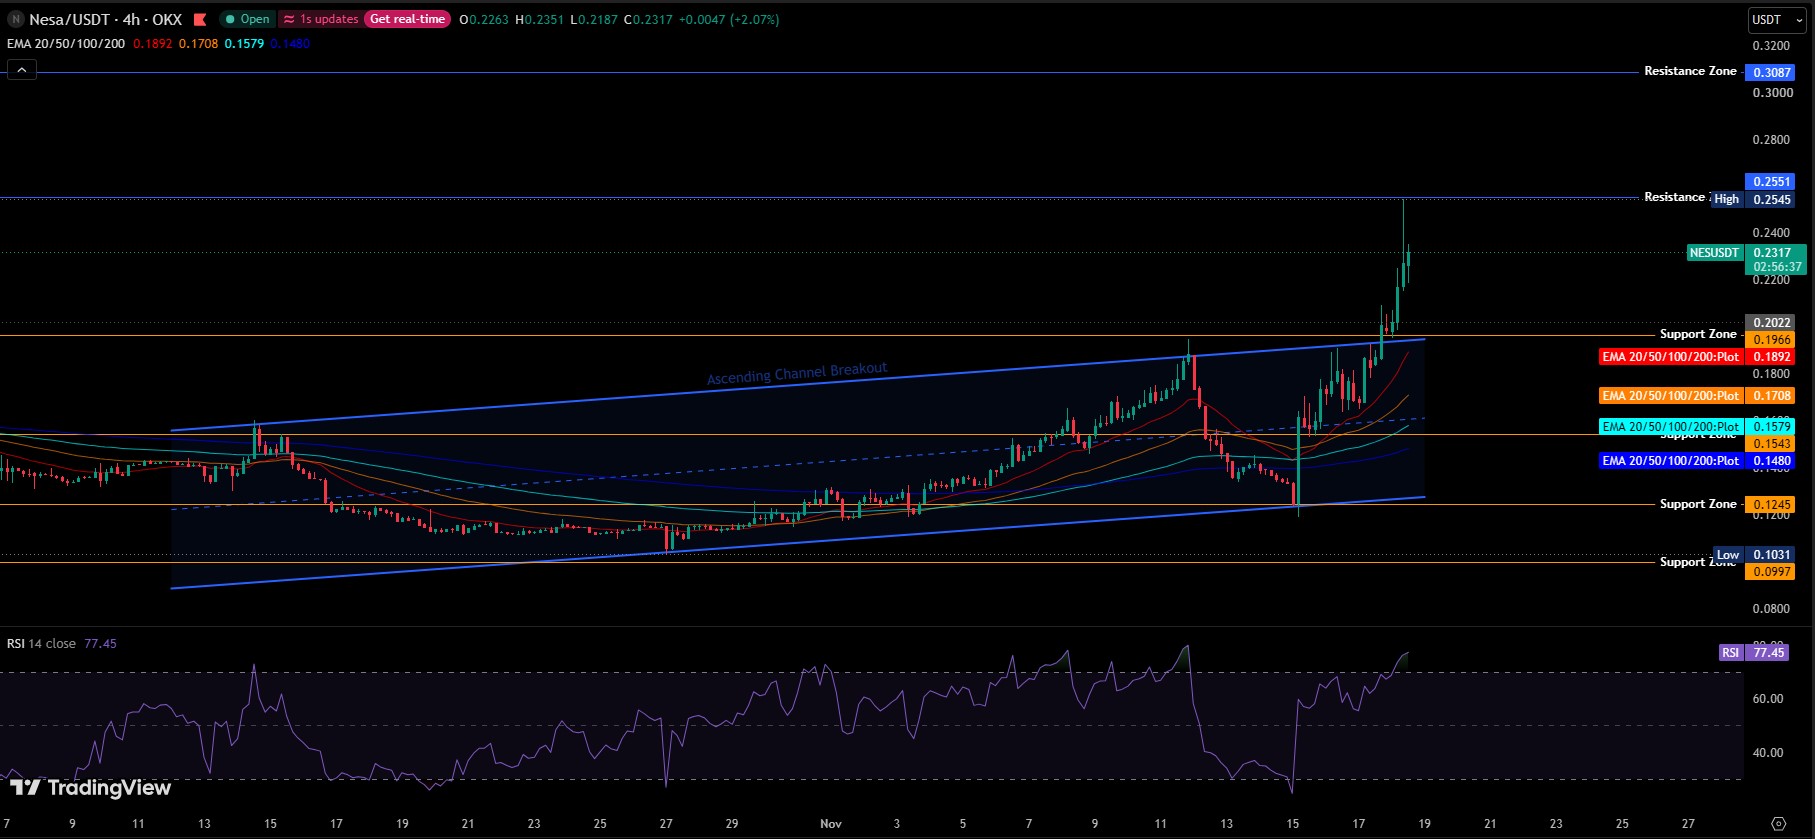
On the TradingView 4h chart, NES/USDT on OKX began in mid-October inside a rising channel, a pair of upward-sloping trendlines that frame price. It tested $0.16, failed, and rolled over.
Selling dragged it to $0.1031 in late October, just above the $0.0997 floor. A slow climb followed, and by early November buyers held the price above the long exponential moving averages. The 200 EMA, an average of the last 200 candles, now sits at $0.1480.
Mid-November brought a rejection. Price hit the channel roof near $0.19, RSI touched about 75, and sellers took the price back to the $0.1245 floor.
RSI fell under 30 there. Sellers looked tired. A large green candle sent the price back to $0.16 in a single 4-hour session.
Higher lows piled up. The ascending channel breakout came near $0.20; the price dipped into the $0.1966 to $0.2022 demand zone and held.
Then came the spike. Straight to $0.2545, where sellers defended $0.2551 and left a long upper wick, a thin line showing price was pushed back down.
NES trades near $0.2317 now, above the 20 EMA at $0.1892, the 50 EMA at $0.1708, and the 100 EMA at $0.1579. Two numbers frame the setup, $0.2022 below and $0.2551 above.
RSI at 77.45 says the run is stretched, so a pullback looks likelier than a straight shot at $0.3087 if $0.2022 fails, then $0.1966 comes next.
NES Price Forecast Scenarios
Over the next 3 days, a retest of $0.2022 looks likelier than a clean run at $0.3087. More setups sit in thelatest price prediction articles.
Scenario
Trigger
Target
Invalidation
Liquidity Condition
Bull
Trades above $0.2551 on rising volume
$0.3087
Falls under $0.2022
Futures volume above $15.76M
Base
Retest holds $0.1966 to $0.2022
$0.2317 to $0.2551 range
Breaks $0.1966
Volume cools, open interest steady near $4.73M
Bear
Trades below $0.1966
$0.1892, then $0.1708
Reclaims $0.2022
Spot net flow stays negative
Nesa Price Outlook and Key Levels
The Nesa price outlook rests on the zones below. Support starts at $0.2022 and $0.1966, then the 20 EMA at $0.1892 and the 50 EMA at $0.1708, and the $0.1245 channel floor.
Resistance sits at $0.2551, followed by $0.3087 and the $0.3595 June high.
Breakout confirmation needs trading above $0.2551 with futures volume over $15.76M. Anything weaker is a spike. Traders can followcrypto exchange listing news for fresh volume sources.
Breakdown risk starts under $0.1966. And a break below $0.1892 puts the 20 EMA behind the price.
Risks That Can Break the Setup
Liquidity is thin, with liquidity-to-market-cap at 0.78%, so a big sell order can move the price several cents.
Fear and greed show 10; extreme fear and a weak Bitcoin day usually hit small caps harder.
AI sector headlines onAI crypto news can move NES either way. And a break of $0.1966 on volume would end the retest that this Nesa price prediction needs.
Final View
This Nesa price prediction favors buyers above $0.2022, with a retest first and $0.3087 as the target on a clean break.
Sellers take control under $0.1966. For other fast small-cap movers,memecoin crypto news covers the sector.
Disclaimer. This article is for information only and isn't financial advice. Crypto prices move fast, no forecast is guaranteed, and traders should do their own research before risking money.