NEX just had one of its sharpest drops since launch, falling close to 20% in a single day. This Nexus price prediction looks at why the token is falling and what the chart is showing right no
NEX just had one of its sharpest drops since launch, falling close to 20% in a single day. This Nexus price prediction looks at why the token is falling and what the chart is showing right now.
Nexus is a high-performance Layer 1 blockchain built for verifiable finance, aiming to merge the speed of centralized exchanges with the trustless design of decentralized systems, using zero-knowledge proofs to power its own on-chain exchange.
With the price now sitting right at a key chart level after this breakdown, the question traders are asking is simple: is this close to a bottom, or is there more room to fall?
Nexus Price Prediction: Market Overview
Metric
Value
24h Range
$0.000001734 – $0.000002205
Market Cap
$104.71M
Fully Diluted Valuation
$174.517M
24h Trading Volume
$5.669M
Circulating Supply
60T $NEX
Total / Max Supply
100T $NEX
NexusCoin News: Why Is NEX Crypto Crashing Today?
NEX only started trading after its mainnet launch in May 2026, which means it is still in an early price-discovery phase.
Coins this new don't have years of trading history or well-tested support zones, so price swings tend to be sharper than they would be for an older, more established token.
On top of that, only 60 trillion of the 100 trillion max supply is currently circulating.
That leaves 40% of total supply still to enter the market over time, and uncertainty about the exact unlock schedule tends to add extra selling pressure whenever sentiment turns cautious
Reduced risk appetite across the broader crypto market has added to the pressure as well.
Put together, this looks less like a single bad headline and more like a young token finding its footing during a rough patch for altcoins generally.
Nexus Price Prediction: Short-Term Chart analysis
On the 1-hour chart, NEX had been trading inside a descending triangle pattern for some time, with lower highs building up against a flat support zone.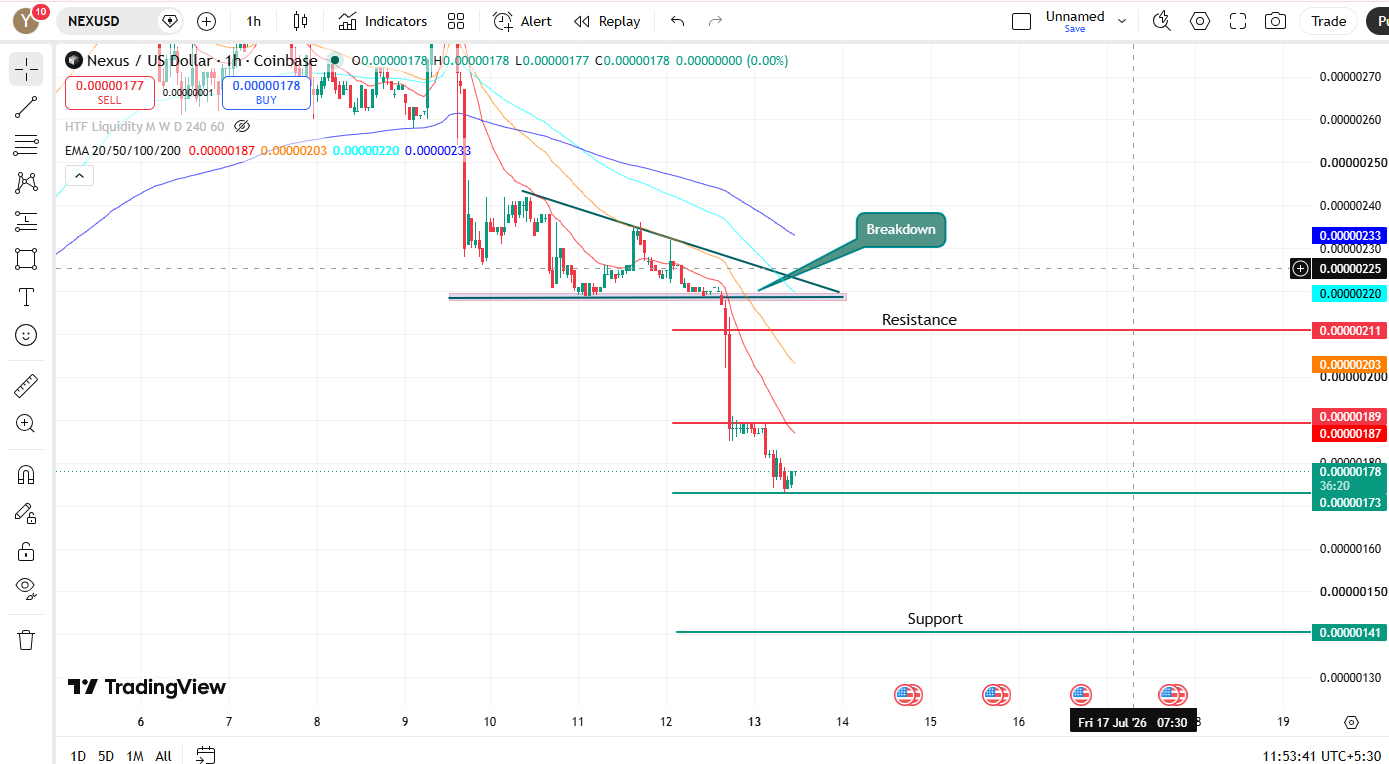
Price finally broke down through that zone, triggering a sharp drop and pushing NEX into the range it's trading in now, around the $0.00000178 price.
That breakdown has brought NEX right to one of its more important levels since the token launched.
Where it goes from here likely depends on whether buyers step in around current levels or selling continues .
NEX is trading well below every major EMA right now. The EMA 20 sits at $0.00000187, the EMA 50 at $0.00000203, the EMA 100 at $0.00000220, and the EMA 200 at $0.00000233.
Nexus Price Prediction: Short-Term Key Levels to Watch
Support Levels
Resistance Levels
$0.00000173
$0.00000189
$0.00000141
$0.00000211
Being under all four keeps the short-term trend tilted bearish, and each of these levels would need to be reclaimed in order for that picture to change.
Nexus Price Prediction: What Various Readers Should Know
For anyone already holding NEX, the $0.00000173 level is the one to watch first. A clean break below that opens the door toward $0.00000141.
For anyone considering an entry here, a move back above $0.00000189 would be the first sign this breakdown is losing momentum, with the EMA 20 at $0.00000187 sitting right in that same zone.
Nexus Price Prediction: Expert View
As per the market analyst, NEX is dealing with two things at once: the natural volatility of a brand-new token and a supply overhang that keeps traders cautious about further unlocks.
The chart backs this up, with price now trading below every major EMA after breaking down from its recent range. The $0.00000173 support is the level that matters most in the short term.
Losing it opens a path toward $0.00000141, while reclaiming $0.00000189 and the EMA 20 above it would be the first real signal that selling pressure is easing
Given how young this token is, expect volatility to stay elevated in either direction
Disclaimer: This content is for informational purposes only and is not financial advice. Crypto markets are highly volatile; always do your own research before making any investment decisions.