What to Know Nullmask (MASK) trades near $0.024666, recovering from November losses as buyers attempt to rebuild momentum following substantial market volatility. Bollinger Bands indicate con
What to Know
- Nullmask (MASK) trades near $0.024666, recovering from November losses as buyers attempt to rebuild momentum following substantial market volatility.
- Bollinger Bands indicate considerable volatility, while the RSI near 52.09 suggests improving buying momentum following the recent market correction phase.
- Maintaining support above $0.021833 could strengthen recovery prospects, while reclaiming $0.036104 may support higher valuations through long-term price projections.
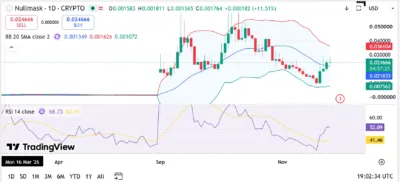
Nullmask (MASK) trades near $0.024666, showing signs of recovery following considerable volatility that pushed the cryptocurrency lower during November. According to the TradingView daily chart, MASK has moved above its middle Bollinger Band of $0.021833, suggesting that buying momentum is improving following the recent market correction.
The chart’s latest candles show buyers attempting to recover from recent declines, while the upper Bollinger Band stands at $0.036104 and the lower band sits near $0.007562. Meanwhile, the Relative Strength Index (RSI) stands at 52.09, above its moving average of 41.46, indicating improving momentum as buying participation strengthens.
Also Read: NotInEmploymentEducationTraining (NEET) Price Prediction 2026–2030: Can NEET Hit $1 Soon?
Market Structure and Price Action
MASK experienced relatively subdued trading throughout March and April, with prices fluctuating near the zero-dollar baseline on the chart before stronger market participation emerged. Trading activity remained relatively limited during the following months, with little directional movement before September introduced substantial volatility.
September marked a considerable shift in market structure as MASK advanced beyond $0.020 and subsequently approached the $0.040 region. The cryptocurrency experienced strong buying activity during the initial rally, although several bearish candles interrupted the upward movement as traders responded to rapidly changing market conditions.
October introduced another substantial advance, with MASK climbing beyond $0.040 before approaching the $0.050 region. Buying participation strengthened during the early sessions, allowing the cryptocurrency to establish a higher trading range before selling pressure interrupted the rally.
The subsequent correction pushed MASK below $0.040, with additional bearish candles driving prices toward $0.025 as the cryptocurrency entered November. The decline reflected weakening buying momentum, with successive lower highs indicating that sellers had regained control of the short-term market structure.
November brought further losses as MASK declined toward the $0.010 region before recovering toward $0.024666. The latest rebound has lifted the cryptocurrency above its middle Bollinger Band, suggesting that buyers are attempting to establish a stronger recovery structure.
Immediate resistance stands near $0.030, followed by $0.036104 and $0.040. A sustained breakout could support another attempt toward $0.050, while renewed selling pressure might expose support around $0.021833, followed by $0.015 and $0.010.
Bollinger Bands Indicate Expanding Market Volatility
MASK trades above its middle Bollinger Band at $0.021833, indicating that buyers have regained some influence following the recent market correction. The lower band stands near $0.007562, providing a broader downside reference should selling pressure intensify considerably.
Meanwhile, the upper Bollinger Band sits at $0.036104, representing an important resistance boundary that buyers would need to challenge to restore stronger bullish momentum. Maintaining prices above the middle band could initially support appreciation toward $0.030 before the upper boundary becomes relevant.
The considerable distance between the upper and lower bands indicates elevated market volatility, reflecting October’s rapid appreciation and the subsequent November correction. Such conditions suggest that substantial price fluctuations remain possible as traders assess whether the latest recovery can develop into a sustained upward movement.
Reaching $0.050 would require approximately 102.72% appreciation from $0.024666, while reaching $1 would demand approximately 3,954.16% growth. Achieving the higher milestone would require considerably stronger buying demand, improving liquidity, and sustained favorable conditions across broader cryptocurrency markets.
RSI Signals Improving Market Momentum
The RSI reading of 52.09 stands above the neutral threshold of 50, indicating that buying momentum has improved following November’s considerable price fluctuations. Its position above the moving average of 41.46 suggests that short-term buying participation has strengthened, although additional confirmation remains necessary.
During September, the indicator moved into elevated territory as MASK advanced through successive resistance regions. October subsequently experienced considerable momentum fluctuations, with the RSI reflecting strong buying participation during the cryptocurrency’s advance toward $0.050.
November’s correction pushed the indicator toward the oversold region as MASK experienced successive bearish sessions. The latest rebound has lifted the RSI above 50, suggesting that selling momentum has weakened compared with the preceding decline.
Maintaining an RSI above 50 could support additional appreciation, potentially allowing MASK to challenge resistance around $0.030 and $0.036104. Conversely, a decline beneath 40 could indicate renewed selling pressure, increasing the possibility of another correction toward the $0.015 support region.
Source: TradingView
MASK Price Predictions (2026–2030)
Year
Minimum Price
Average Price
Maximum Price
2026
$0.010
$0.025
$0.050
2027
$0.008
$0.045
$0.100
2028
$0.020
$0.090
$0.200
2029
$0.040
$0.180
$0.450
2030
$0.080
$0.350
$1.200
Yearly Insights
2026
MASK’s remaining 2026 outlook depends on maintaining support around $0.021833 and reclaiming resistance near $0.036104. Stronger buying participation could support an advance toward $0.050, while renewed selling pressure might expose the $0.010 region if the current recovery fails to establish sustained momentum.
2027
Improving cryptocurrency market conditions could support an advance toward $0.100 if investor demand strengthens and trading participation expands. Nevertheless, weaker liquidity and prolonged bearish pressure could restrict MASK toward the projected $0.008 minimum, particularly if the cryptocurrency struggles to maintain its broader recovery structure.
2028
Broader cryptocurrency market expansion and sustained investor demand could allow MASK to challenge $0.200, provided buying participation improves considerably. Unfavorable market conditions could instead restrict appreciation, potentially bringing prices toward the projected $0.020 minimum as traders reassess the cryptocurrency’s long-term growth prospects.
2029
Sustained buying demand and favorable cryptocurrency market conditions could support appreciation toward $0.450, bringing MASK closer to higher long-term valuation targets. Nevertheless, prolonged selling pressure, insufficient liquidity, and weakening investor participation could limit MASK closer to the projected $0.040 minimum.
2030
A favorable long-term scenario places MASK near $1.200, provided market participation, liquidity, and underlying token demand strengthen substantially. Reaching $1 would require approximately 3,954.16% appreciation from $0.024666, making the milestone mathematically possible under an exceptionally bullish scenario but highly speculative without considerable improvements in market fundamentals.
Conclusion
MASK shows signs of improving momentum following its recovery toward $0.024666, with trading above the middle Bollinger Band at $0.021833 indicating that buyers have regained some short-term control. The RSI reading of 52.09 supports this improvement, while its position above the signal average suggests strengthening buying participation.
Maintaining $0.021833 could support another advance toward $0.030 and $0.036104, while losing this level might expose additional downside toward $0.015 and $0.010. The $1 target remains highly speculative and would require sustained demand, stronger liquidity, and favorable cryptocurrency market conditions through 2030.
FAQs
1. What is the immediate support level for MASK?
Immediate support stands near $0.021833, followed by the $0.015 and $0.010 price regions. The lower Bollinger Band at $0.007562 represents a broader technical reference should selling pressure intensify.
2. What is the next major resistance for MASK?
MASK faces immediate resistance around $0.030, followed by $0.036104 and $0.040. A sustained breakout above these levels could strengthen bullish momentum, potentially allowing buyers to challenge the $0.050 region.
3. What does MASK’s RSI indicate?
The RSI reading of 52.09 indicates improving buying momentum, with its position above 50 suggesting that buyers have regained some short-term influence. Its movement above the RSI moving average of 41.46 further supports the improving momentum structure.
4. Can MASK reach $1 before 2030?
Reaching $1 would require approximately 3,954.16% appreciation from $0.024666, equivalent to roughly 40.54 times its current price. Such a target remains highly speculative and would depend on substantial improvements in demand, liquidity, adoption, and broader cryptocurrency market conditions.
5. Why is the Bollinger Band midline important?
The $0.021833 midline represents the 20-day moving average, helping identify the underlying price trend and potential support during market recoveries. MASK’s position above this level indicates improving buying momentum, although maintaining the midline remains important for supporting a more sustained recovery.
Also Read: OKZOO Price Prediction 2026–2030: Can OKZOO Reach $1 Soon?
The post Nullmask (MASK) Price Prediction 2026–2030: Can MASK Hit $1 Soon? appeared first on 36Crypto.