The OFFICIAL TRUMP meme coin just got hit by one of the biggest news stories in its short life. A major investigation revealed that insiders made hundreds of millions while regular buyers los
The OFFICIAL TRUMP meme coin just got hit by one of the biggest news stories in its short life. A major investigation revealed that insiders made hundreds of millions while regular buyers lost even more.
So what does the chart say now, and is there any real reason to stay hopeful?
Why TRUMP Coin Is Falling Right Now
The OFFICIAL TRUMP price prediction story has taken a sharp turn this week. A major report from a global news agency says the Trump family made around $616 million from the coin since it launched. At the same time, regular buyers lost over $700 million.
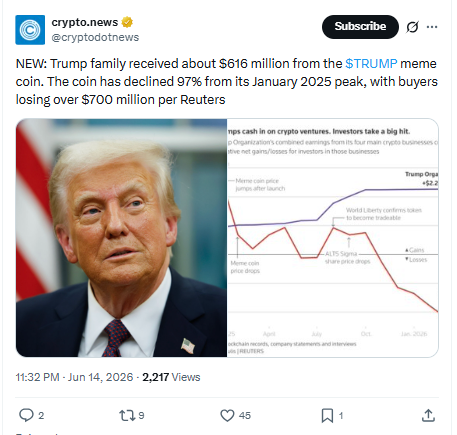
Source: Report shared on X by Cryptodotnews
That news hit the market hard. Traders who were already taking profits after last week's 20% run now have a fresh reason to sell. And the broader crypto market went up while TRUMP went down; that gap tells you everything.
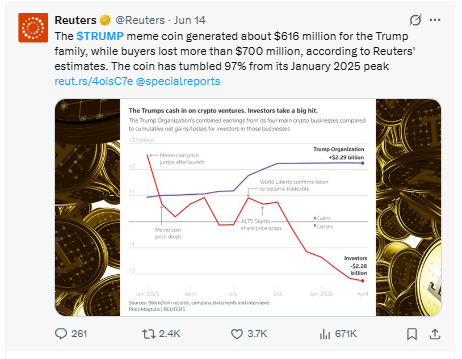
Source: Report shared on X by Reuters
What Is OFFICIAL TRUMP and Where Does It Come From
Detail
Data
Coin Name
OFFICIAL TRUMP
Ticker Symbol
TRUMP
Blockchain
Solana
Today High
$2.10
Today Low
$1.97
RSI Level
49.81
Token Type
Meme / Political
Market Cap
$471.37M
24H Trading Volume
$275.8M
Circulating Supply
237.41M TRUMP
24H Change
-2.82%
Source: Data by CoinMarketCap
Why Traders Are Still Watching This Coin
This coin has 645,710 holders and a 24-hour volume of $275.8 million. That's not tiny. Big exchanges like OKX ($157M), Binance ($157M), and Bybit ($67M) are all moving real money here.
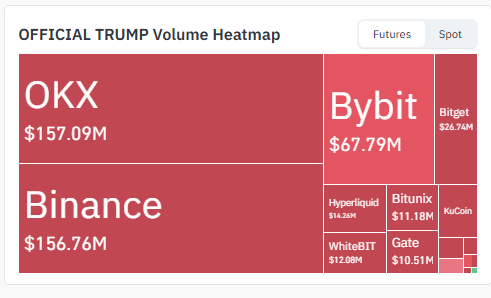
Source: Volume heatmap data by CoinGlass
Liquidation Numbers Are Telling a Story
Over the last 24 hours, $1.99 million worth of positions got wiped out. Long positions accounted for $1.29 million of that. Short positions saw $701,950 cleared.
Over 12 hours, $915,760 was liquidated — with $534,010 in short positions and $381,750 in longs. That means more short bets got squeezed than long ones during that window.
What the TRUMP Chart Is Saying Right Now
Here's the thing: the chart is not friendly. The price is stuck inside a falling shape called a descending triangle. That usually means more price drops are coming if the floor breaks. This is based on the 4-hour time frame.
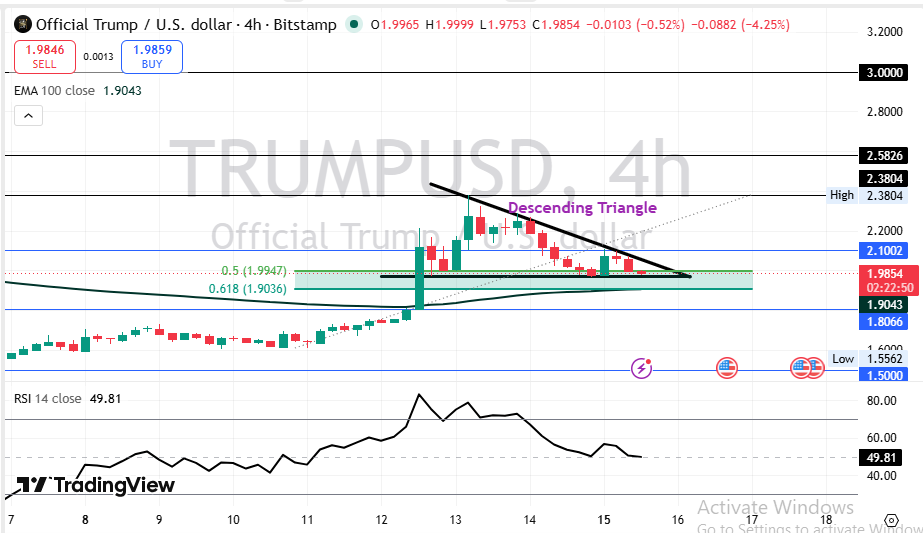
Source: Charting by TradingView, 4H chart
The coin sits right on the 0.618 Fibonacci level at $1.9036. The 0.5 Fibonacci level above is $1.9947. The 100 EMA is at $1.9043, and the price is barely above it right now.
RSI is at 49.81. That's almost exactly in the middle. It doesn't lean either way yet. But if the price cracks $1.90, the RSI will likely drop fast.
This section reads like a fast market alert because it is. The coin is at a key point right now. One more bad day could push it into a new danger zone.
Short-Term Price Outlook for TRUMP Coin
The next few days are all about $1.90. If that floor holds, the price could bounce. If it breaks, the drop could be quick and sharp. Here's the short-term table:
Timeframe
If Price Falls
Most Likely
If Price Rises
What Could Cause This
24 Hours
$1.80
$1.95
$2.10
Bad news fades; small bounce from oversold
3–7 Days
$1.65
$1.90
$2.25
The market calms, traders buy the dip slowly
2–4 Weeks
$1.50
$2.00
$2.40
Peace deal news and broader crypto rally
Watch the $1.90 level closely. A daily close below it changes everything.
Long-Term Price Forecast for OFFICIAL TRUMP
The long view is harder to read. This coin has no real use case beyond its name and the attention it gets. That's not always fatal, but it means every price move is driven by feelings, not facts.
Timeframe
If Price Falls
Most Likely
If Price Rises
What Needs to Happen
3 Months
$1.20
$2.20
$3.00
Coin holds $1.90 and gets fresh positive news
6 Months
$0.90
$2.50
$4.00
Bitcoin climbs and meme coins follow the wave
End of Year
$0.70
$3.00
$5.50
Strong meme season and political excitement
2027 Outlook
$0.40
$1.80
$7.00
Depends fully on political news cycles
The long-term case is weak on facts. It's entirely news-driven. That makes it unpredictable, not impossible, just very risky.
Three Ways This Could Play Out From Here
Worst Case:The Reuters report keeps spreading. New sellers pile in daily, and the $1.90 floor breaks fast. Price drops to $1.50 or even lower as the market loses faith in the coin completely.
Most Likely Case:The news shock fades after a few days. Price holds near $1.90 and moves sideways. A slow and quiet recovery brings the price back above $2.00 within two to three weeks.
Best Case:The Iran peace deal gets signed on June 19. Risk appetite comes back across all of crypto. TRUMP catches a wave and pushes above $2.38 toward the next big price wall.
Scenario
Price Range
What Makes It Happen
Worst Case
$1.50 – $1.75
Reuters story keeps spreading and the floor breaks
Most Likely
$1.90 – $2.10
News fades and price moves sideways for weeks
Best Case
$2.40 – $3.00
Peace deal signed and crypto market goes risk-on
Key Price Walls to Watch This Week
Price wall above: $2.1002 is the first one. Above that, $2.3804 is the next big wall. Then $2.5826 and $3.00 after that.
Price floor below:$1.9036 is the most important one right now. If that breaks, $1.8066 is the next stop. Below that, $1.50 is a major floor that traders will watch.
Break point: A daily close below $1.80 would be a serious warning sign. Below $1.50, the short-term setup is fully broken.
Bitcoin Price Prediction: What Happens Next?
Bitcoin is at a pivotal turning point in 2026, with institutional adoption, spot ETF inflows, post-halving supply dynamics, and growing regulatory clarity shaping its next major rally.
Technical indicators signal oversold conditions, making this a crucial moment for investors. Read our detailedBitcoin price prediction to find out exactly what happens next.
What Analysts Are Saying and Where This Goes Next
The chart setup isn't great. A descending triangle with RSI near 50 and price barely above the 100 EMA—that's not a setup traders get excited about.
We're watching a coin that could go either way in the next 48 hours, and that uncertainty is real.
The Reuters story is the big wildcard outside the chart. If it keeps spreading on social media, new sellers will keep showing up. And that's not something a chart can stop.
But here's what most traders are missing: the $1.90 level is doing a lot of work right now. It's where the 100 EMA sits, it's where the 0.618 Fibonacci sits, and it's the floor of the triangle. Three things pointing to the same price wall at once—that's not nothing.
We pulled up the RSI, and the first thing that stood out was how flat it is. No strong move either way yet. That means the next push, up or down, could set the tone for the rest of the month.
One thing to ask: Does positive news from the Iran peace deal on June 19 change anything here? Maybe. But the Reuters story may be louder. And that raises a bigger question, one the market hasn't answered yet.
The most important price to watch right now is $1.90. Hold it, and the coin has a shot. Lose it, and $1.50 comes fast.
Risk is still real.
Disclaimer
This article is for learning only and does not tell you what to do with your money. Crypto prices can go up or down very fast. Talk to a money advisor before you invest.