OFFICIAL TRUMP ($TRUMP) is back in the spotlight, and the charts are doing most of the talking. After weeks stuck inside a tightening wedge, the token has finally broken free, and the move lo
OFFICIAL TRUMP ($TRUMP) is back in the spotlight, and the charts are doing most of the talking.
After weeks stuck inside a tightening wedge, the token has finally broken free, and the move looks far from ordinary. $TRUMP trades near $2.92, up close to 9% on the day and over 57% for the week.
For anyone following this Official TRUMP price prediction, the question now is simple: can OFFICIAL TRUMP push toward $4 and test $5, or is this rally due for a pause?
Derivatives Desk: Long Positions Are Piling Up
According to CoinGlass data, TRUMP's derivatives market is leaning firmly bullish.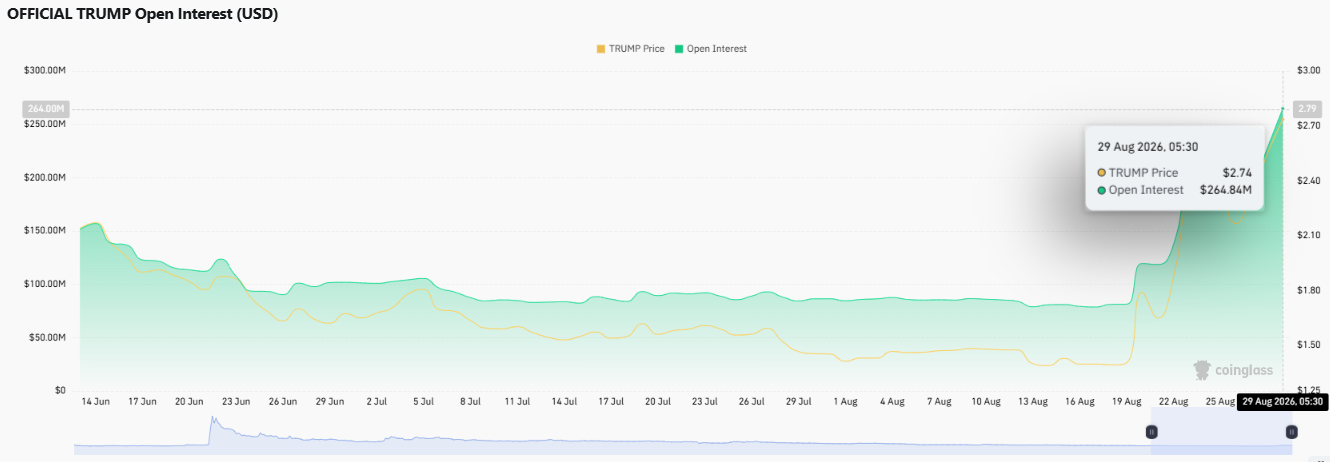
Open interest has jumped to $264.84M as of August 29, 2026, up from levels closer to $100M just days earlier, a sign that fresh capital is entering futures alongside the rally.
Long/short ratios back this up: Binance's TRUMP/USDT accounts show a 2.4662 long bias, while top traders run an even richer 2.5149 ratio.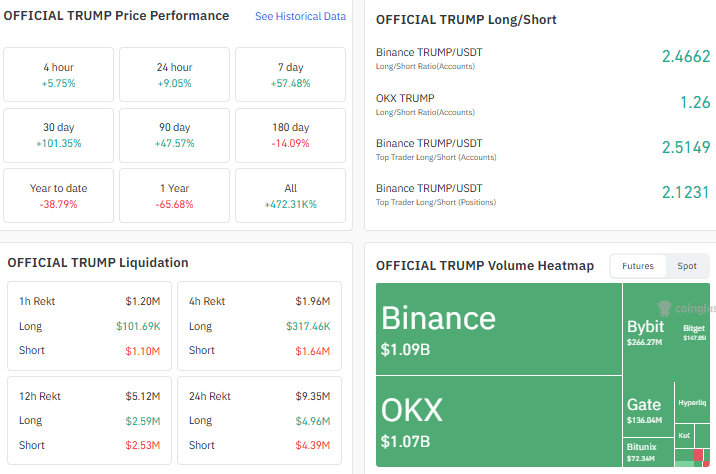
Short positions have also taken the bigger liquidation hit lately, including roughly $1.64M in short liquidations over four hours against just $317K on the long side.
On performance, $TRUMP is up 101.35% over 30 days and 47.57% over 90 days, though still down 65.68% across the past year. Binance and OKX lead futures volume at $1.09B and $1.07B, respectively.
Where Official Trump Stands in the Crypto Market
As per CoinMarketCap data,OFFICIAL TRUMP holds a market cap of around $734.06M, while its fully diluted valuation sits near $2.92B against a total supply of 999.99M and a circulating supply of just 250.86M.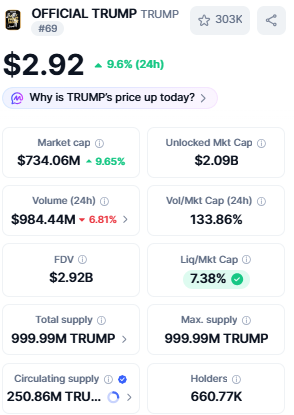
Daily volume stands at $984.44M, a volume-to-market-cap ratio of 133.86% that shows how actively this OFFICIAL $TRUMP price prediction story is being traded.

On-chain data shows holders remain strong at over 661,000 wallets.
Bull, Bear, and Neutral Signals for TRUMP
Signal
What It Shows
Bullish
Wedge breakout confirmed, rising open interest, long-heavy futures positioning
Bearish
RSI above 70 signals overbought conditions; the token is still down sharply on a 1-year basis
Neutral
24-hour volume cooling by 6.81%; price consolidating just under resistance
Technical Chart Read: TRUMP's Price Structure
As per the TradingView chart, OFFICIAL $TRUMP spent nearly three months trapped inside a descending wedge, a pattern of lower highs as selling pressure slowly faded.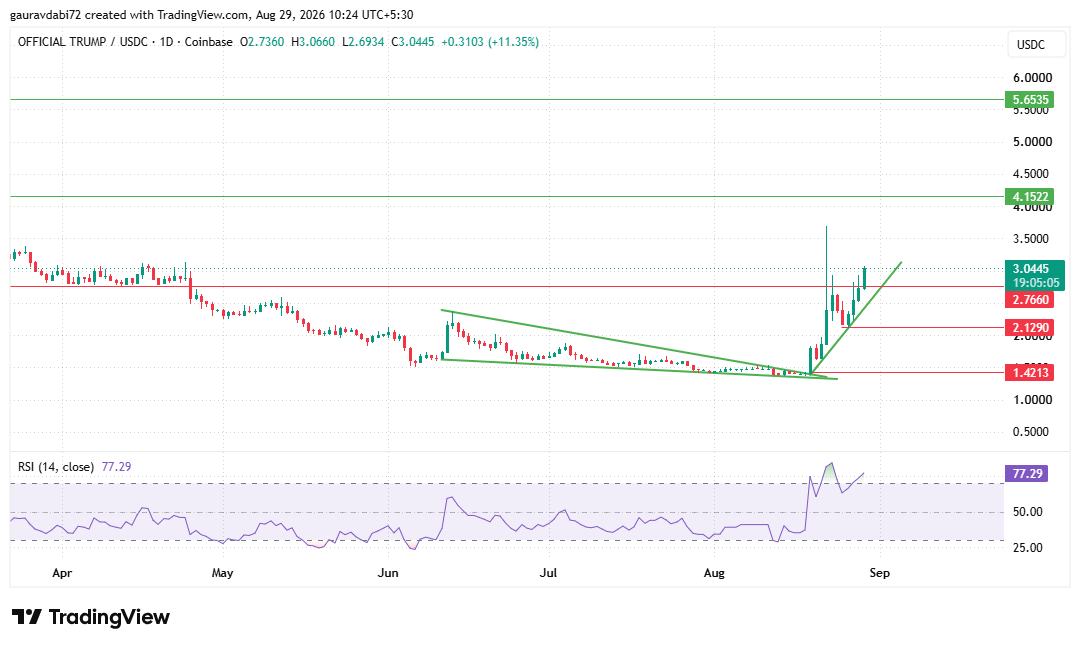
That pressure broke in August, when $TRUMP pushed decisively above the wedge's upper trendline on strong volume, confirming a shift in structure.
The daily RSI (14) now reads 77.29, well inside overbought territory, which often precedes short-term cooling even within a broader uptrend.
If $TRUMP manages a daily close above the current level of $3, the next levels $TRUMP can go toward are $4.1522, followed by the bigger $5.6535 zone that anchors this $TRUMP price prediction narrative.
Should momentum fade instead, the nearest support levels $TRUMP could revisit are $2.7660, then $2.1290, and further down $1.4213, the same zone where this breakout originally began.
CoinGabbar Analyst Desk View
According to the CoinGabbar analyst desk, $TRUMP's breakout from a multi-month wedge, paired with rising open interest, points to a genuine shift in sentiment rather than a short-lived spike.
That said, an RSI above 77 suggests the move is stretched, and a cooldown or retest of the broken trendline wouldn't be unusual before the next leg.
Anyone tracking this TRUMP price prediction should watch whether volume holds up, since that will likely decide whether $4.1522 gets tested soon or $TRUMP consolidates first.
Disclaimer: This article is for informational purposes only and should not be considered financial or investment advice. Cryptocurrency markets are highly volatile; readers are advised to do their own research before making any decisions.