Official Trump (TRUMP) is a token that launched in early 2025 and quickly became one of the most actively traded politically themed digital assets by market volume. It currently trades around
Official Trump (TRUMP) is a token that launched in early 2025 and quickly became one of the most actively traded politically themed digital assets by market volume.
It currently trades around $2.94, up sharply over the past day.
This official Trump price prediction looks at where TRUMP could head next based on daily chart structure, derivatives positioning, and exchange activity.
Live Market Data
Metric
Value
Price
$2.94
24h Change
+72.9%
24h Range
$1.69 - $3.60
Market Cap
$728.675M
Fully Diluted Valuation
$2.935B
24h Trading Volume
$1.685B
Circulating Supply
248.251M
Total Supply
1B
Max Supply
1B
Source: $TRUMP market cap data taken from Coingecko, data as of Aug 22, 2026. Figures may vary slightly across other tracking websites.
Liquidation Snapshot
Window
Total Liquidated
Longs
Shorts
1 Hour
$2.72M
$1.66M
$1.06M
4 Hour
$25.19M
$11.16M
$14.04M
12 Hour
$26.68M
$11.67M
$15.01M
24 Hour
$28.40M
$12.17M
$16.24M
Source: Liquidation Data Taken From Coinglass.
Short positions have taken the larger hit across the 4-hour, 12-hour, and 24-hour windows, which tracks with a rally of this size catching bearish positioning offside.
The 1-hour window flipping toward longs suggests some profit-taking has started creeping in near current levels.
Exchange Volume
Futures trading in TRUMP is dominated by the two largest venues.
Binance leads with $1.29B in 24-hour futures volume, followed by OKX at $987.60M. 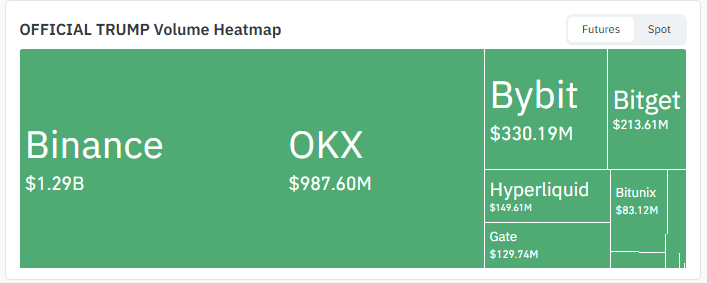
Source: Volume Heatmap Data Taken From Coinglass.
Bybit and Bitget trail behind at $330.19M and $213.61M, respectively, while Hyperliquid, Gate, and Bitunix round out the mid-tier exchanges.
This concentration on major platforms suggests the current rally in this official Trump price prediction is drawing genuine liquidity rather than being isolated to a single smaller exchange.
Key Takeaways
TRUMP trades near $2.94, up 72.9% in 24 hours, after breaking a falling trendline on the daily chart with a sharp upward move.
This official Trump price prediction hinges on whether momentum extends toward $3.811 or fades into a rejection at resistance.
A push through resistance could open the path toward $4.499 and $5.004, while a rejection risks a drop back toward $2.377.
Short positions have taken the bigger liquidation hit over the past 24 hours, consistent with the scale of this rally.
Futures volume is heavily concentrated on Binance and OKX, together accounting for the bulk of 24-hour activity.
Technical Analysis: Trendline Breakout Sparks a Sharp Rally
$TRUMP had been grinding lower for weeks inside a falling trendline on the daily chart, with price compressing tightly just above the $1.5 to $1.9 zone.
That trendline has now broken, and the break came with a genuinely sharp move; the price jumped over 60% in a single session off the breakout point. 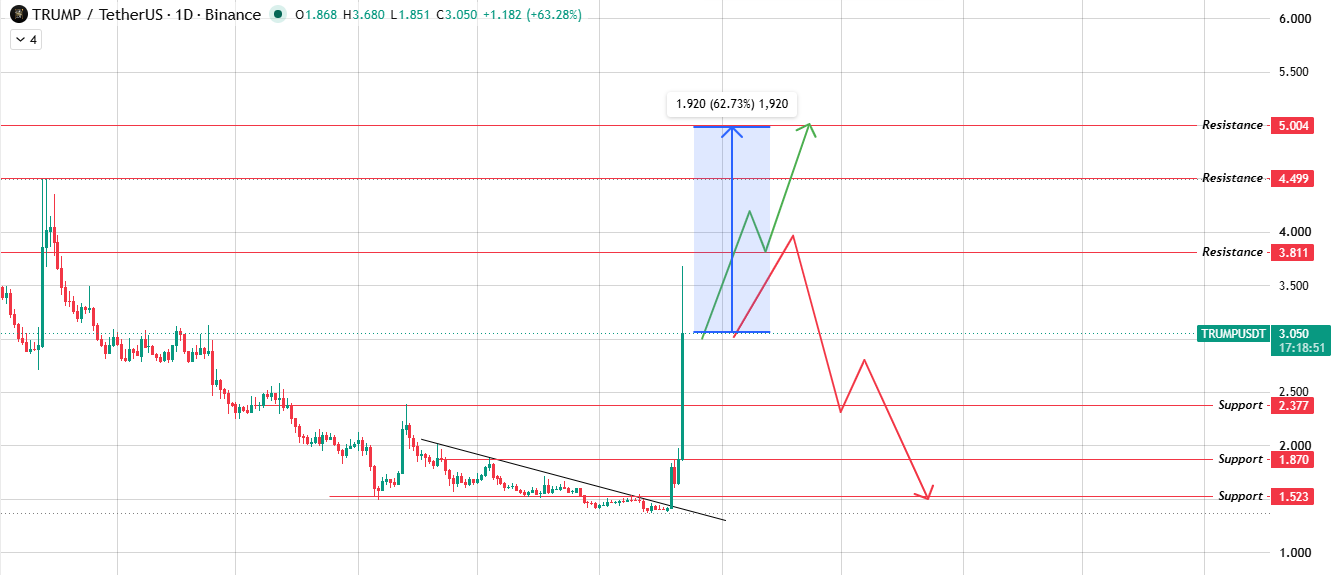
Source: Chart Taken From TradingView.
This official Trump price prediction comes down to what happens next at resistance.
If buying momentum carries through, $3.811 is the first real test, and clearing it opens room toward $4.499 and eventually $5.004.
But if sellers show up at resistance and momentum fades, a rejection could send the price back down through $2.377, with $1.870 and $1.523 as deeper support levels if the pullback extends further.
Support and Resistance Levels
Level Type
Price
Resistance 3
$5.004
Resistance 2
$4.499
Resistance 1
$3.811
Current Price
$2.94
Support 1
$2.377
Support 2
$1.870
Support 3
$1.523
Bull, Base, and Bear Case
Scenario
Setup
level
Invalidation
Bull
Momentum holds, and price clears $3.811 resistance.
$4.499 - $5.004
Below $2.377
Base
Price consolidates between the breakout zone and resistance.
$2.377 - $3.811
Loss of $1.870
Bear
Rejection at resistance, sellers step in
$2.377 - $1.870
Below $1.523
Glossary
Falling Trendline: A downward-sloping line connecting a series of lower highs on a chart. A confirmed close above it is often treated as an early signal that selling pressure is losing control.
Breakout: A move where price decisively clears a level, trendline, or range that had been containing it, often accompanied by a spike in volume and volatility.
Rejection: When a price approaches a resistance level and gets pushed back down rather than breaking through, it usually signals active selling at that zone.
Liquidation: The forced closing of a leveraged futures position when losses exceed the trader's available margin. A wave of liquidations in one direction often amplifies the price move in the opposite direction.
Support Level: A price zone where buying interest has historically been strong enough to slow or reverse a decline.
Resistance Level: A price zone where selling interest has historically been strong enough to slow or reverse an advance.
Methodology
This official Trump price prediction is built from daily chart technical analysis, live liquidation data, futures exchange volume data from Coinglass, and current market data.
All price levels referenced come directly from the chart provided, with no extrapolated or speculative levels.
Disclaimer: This article is for informational purposes only and does not constitute financial, investment, or trading advice. Cryptocurrency markets, including Official Trump (TRUMP), are highly volatile and speculative. Any price levels, levels, or scenarios discussed are probability-based observations drawn from technical and derivatives data, not guarantees. Please conduct your own research and consult a qualified financial advisor before making investment decisions.