What to Know: TRUMP trades near $2.8132 at symmetric triangle resistance, while rising short-term EMAs preserve a constructive technical structure beneath its price. A confirmed move above $3
What to Know:
- TRUMP trades near $2.8132 at symmetric triangle resistance, while rising short-term EMAs preserve a constructive technical structure beneath its price.
- A confirmed move above $3 could target $3.69, whereas losing $2.40 may expose the $2.02 EMA support level positioned below.
- Insider liquidity withdrawals, senators’ SEC request, and World Liberty’s banking ties add significant political and regulatory uncertainty to TRUMP’s outlook.
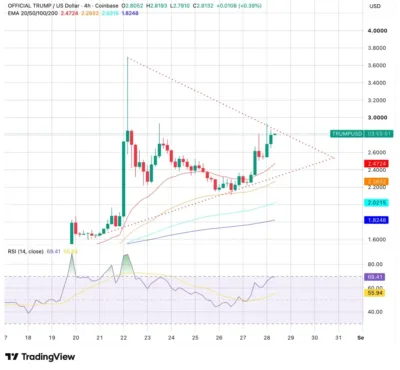
Official Trump (TRUMP) is approaching a crucial technical decision following an extremely volatile period that produced an 80% rally and a rapid 33% reversal. The token trades near $2.8132, positioned at the upper boundary of a symmetric triangle formed by descending resistance from $3.70 and ascending support originating near $1.60.
Momentum remains constructive but stretched, with the Relative Strength Index at 69.41 after reaching 80 twice during August. Meanwhile, the 20-period EMA at $2.4724 and the 50-period EMA at $2.2652 remain below the market price, providing potential support if buyers fail to secure an immediate breakout.
Also Read: Cash Cat (CASHCAT) Price Prediction 2026–2030: Can CASHCAT Hit $0.30?
TRUMP Triangle Approaches a Decisive Breakout Point
TRUMP has spent approximately two weeks compressing inside its symmetric triangle, gradually reducing the distance between support and resistance. The formation’s apex falls in early September, making a decisive directional move increasingly likely.
A daily close above the $2.90–$3 resistance zone would confirm a bullish breakout and potentially attract additional buying activity. Under that scenario, $3.40 could become the first major objective before traders challenge the August spike high around $3.69.
However, rejection at the triangle’s upper boundary would preserve the consolidation structure and shift attention toward $2.47, where the 20-period EMA offers initial dynamic support. A breakdown below $2.40 would weaken the bullish setup and expose the 50-period EMA around $2.27. Stronger selling pressure could eventually drive TRUMP toward the 100-period EMA at $2.02, followed by the 200-period EMA near $1.82.
RSI and Moving Averages Support Bulls
TRUMP’s RSI reading of 69.41 places the token slightly below overbought territory, showing that buyers retain control despite the earlier reversal. Nevertheless, momentum has already reached 80 twice, indicating that aggressive rallies can become overheated quickly.
Both the 20-period and 50-period EMAs are turning upward beneath the market price, reflecting the strength of the August advance. Maintaining price above these indicators would preserve the constructive short-term structure, even if TRUMP remains unable to break $3 immediately.
Source: Tradingview
Conversely, an RSI decline below neutral territory combined with a loss of the EMA cluster could confirm fading demand. Such a development would strengthen the possibility of a deeper correction toward $2.02 or $1.82.
Official Trump (TRUMP) Price Prediction 2026–2030
YearMinimumAverageMaximum2026$1.82$3.00$3.692027$2.10$3.80$5.002028$2.70$4.80$6.502029$3.30$6.20$8.202030$4.00$7.50$10.00
Price Forecast by Year
2026
TRUMP could trade between $1.82 and $3.69 during 2026 as buyers and sellers react to the triangle breakout, insider wallet activity and regulatory developments. A confirmed close above $3 would improve the possibility of retesting the August high, while losing $2.40 could expose the longer-term EMA support levels.
2027
Greater exchange accessibility and sustained political attention could support an advance toward $5 in 2027. However, TRUMP would need to establish reliable support above $3.69 and avoid repeated liquidity withdrawals capable of damaging investor confidence.
2028
Under favorable cryptocurrency market conditions, TRUMP could reach approximately $6.50 in 2028. This projection would require stronger trading liquidity, broader adoption and reduced concerns surrounding the concentration of tokens in project-linked wallets.
2029
TRUMP could approach $8.20 during 2029 if the token develops a consistent structure of higher highs and higher lows. Political visibility may support demand, although its connection to President Donald Trump could also produce substantial price swings around legal, regulatory and electoral developments.
2030
A sustained bullish cycle could potentially lift TRUMP toward $10 by 2030. From the reference price of $2.8132, reaching that target would require growth of approximately 255%, alongside lasting market interest and considerably improved investor confidence.
World Liberty Bank Adds Political Attention
Abu Dhabi’s Sheikh Tahnoon bin Zayed al Nahyan reportedly backs a 49% stake in World Liberty Financial’s new bank, which received preliminary approval from the Office of the Comptroller of the Currency. The institution plans to manage USD1, World Liberty’s stablecoin valued at approximately $4 billion.
Tahnoon previously invested $500 million in World Liberty during January 2025, with $263 million flowing to Trump family entities. Meanwhile, a Trump-affiliated entity holds 38% of the new bank.
The arrangement has attracted ethical concerns because it coincides with the administration’s approval of artificial intelligence chip exports benefiting G42, another company connected to Tahnoon. The White House has denied that the relationship creates a conflict of interest.
Senators Request SEC Investigation
Senators Elizabeth Warren and Richard Blumenthal have asked the Securities and Exchange Commission to investigate whether TRUMP operated as an illegal scam or possible “rug pull.”
Their request cited reports estimating that investors collectively lost $3.8 billion while Trump-linked wallets generated approximately $636 million. Although SEC guidance generally excludes memecoins from securities regulation, projects cannot use the memecoin label solely to avoid legal obligations.
No public SEC response has been issued, leaving the possible investigation as an important risk for TRUMP holders.
Insider Withdrawals Increase Selling Concerns
Wallets linked to the TRUMP project removed USDC from liquidity pools again on August 24, extending a withdrawal pattern observed since April 2025. An earlier $6.2 million transfer to OKX contributed to the 33% reversal that followed the token’s 80% surge.
Repeated liquidity withdrawals can reduce market depth and increase price sensitivity, particularly when traders interpret transfers to centralized exchanges as possible preparation for selling. Consequently, wallet activity remains a central factor influencing TRUMP’s short-term outlook.
Conclusion
TRUMP stands near a decisive technical point, trading around $2.8132 at the upper boundary of a symmetric triangle. A daily close above $2.90–$3 could confirm a breakout toward $3.40 and eventually $3.69.
However, losing the $2.40–$2.47 support region would weaken the pattern and expose $2.27, $2.02 and potentially $1.82. Political attention surrounding World Liberty Financial could sustain speculative demand, but insider liquidity withdrawals and the requested SEC investigation create substantial downside risks.
Reaching $10 by 2030 remains possible only under a highly bullish scenario. TRUMP would require sustained demand, deeper liquidity, reduced regulatory uncertainty and stronger confidence in project-linked wallet management.
FAQs
1. Is TRUMP currently bullish?
TRUMP maintains a moderately bullish structure because it trades above its rising 20-period and 50-period EMAs, although resistance near $3 remains unbroken.
2. What is the main TRUMP resistance level?
The primary resistance zone sits between $2.90 and $3. A confirmed breakout could expose $3.40 before the August high near $3.69.
3. What are the important TRUMP support levels?
Immediate support stands between $2.40 and $2.47, followed by $2.27, $2.02 and the 200-period EMA near $1.82.
4. Can TRUMP reach $10 by 2030?
TRUMP could reach $10 under an extended bullish scenario, requiring approximately 255% growth from its reference price near $2.8132.
5. What could weaken the TRUMP outlook?
Insider liquidity withdrawals, formal SEC action, declining speculative demand, adverse political developments and a triangle breakdown could place further pressure on TRUMP.
Also Read: Monad (MON) Price Prediction 2026–2030: Can MON Hit $0.10?
The post Official Trump (TRUMP) Price Prediction 2026–2030: Can TRUMP Reach $10? appeared first on 36Crypto.