ORBIO price prediction: $ORBIO just ripped 130%+ in a week, but RSI screams overbought. Support, resistance, and 2026-2030 targets inside, plus the exact level that breaks this bullish setup.
ORBIO price prediction: $ORBIO just ripped 130%+ in a week, but RSI screams overbought. Support, resistance, and 2026-2030 targets inside, plus the exact level that breaks this bullish setup.
$ORBIO trades near $0.0165 as of September 7, 2026, 05:42 UTC, up sharply from a launch price near zero on August 31, 2026.
Barely a week old. Every number here carries a warning label.
Quick Prediction Snapshot
Metric
Reading
Current Price
$0.0165 (GeckoTerminal, 05:42 UTC)
24H Change
+25.77% to +147% depending on source
Trend
Bullish, overbought
Next Target
$0.0265
Support
$0.0130
Resistance
$0.0265
RSI (14)
70.43
Bull Case
$0.055
Base Case
$0.020
Bear Case
$0.008
Invalidation
Below $0.0090 on volume
Numbers shift fast on a token this new. Treat this as a snapshot, not a promise.
Orbio.so Price Prediction: Key Takeaways
$ORBIO launched six days ago and has run over 130% from its lows, per CoinGecko. The Orbio.so price prediction picture leans bullish, but it's an overbought bullish. For context against other coins, browse more price predictions.
Support sits near $0.0130. Resistance sits near $0.0265. RSI at 70 says buyers are stretched. That combination usually means a pause, not a straight line up.
Why Is $ORBIO Moving Today?
ORBIO's Recent Price Action
The token opened near $0.013 on the current four-hour candle and pushed to a high of $0.0166, per the live chart on GeckoTerminal. Up roughly 25% on the day.
Wide spread from the 24-hour low. Illiquid tokens do that.
Trading Volume and Liquidity
24-hour volume runs $300,000 to $2.36 million depending on the venue, against liquidity of about $509,000. That's thin. Newexchange listings would help close that gap.
A move backed by real volume tends to hold. One backed by a handful of wallets doesn't, and this sits somewhere between the two.
What Is Driving $ORBIO?
The project's been active, positioning as a marketplace where holders trade discountedAI token inference credits, with a points program tied to holding that works a lot like acrypto airdrop, per a recentproject update on X.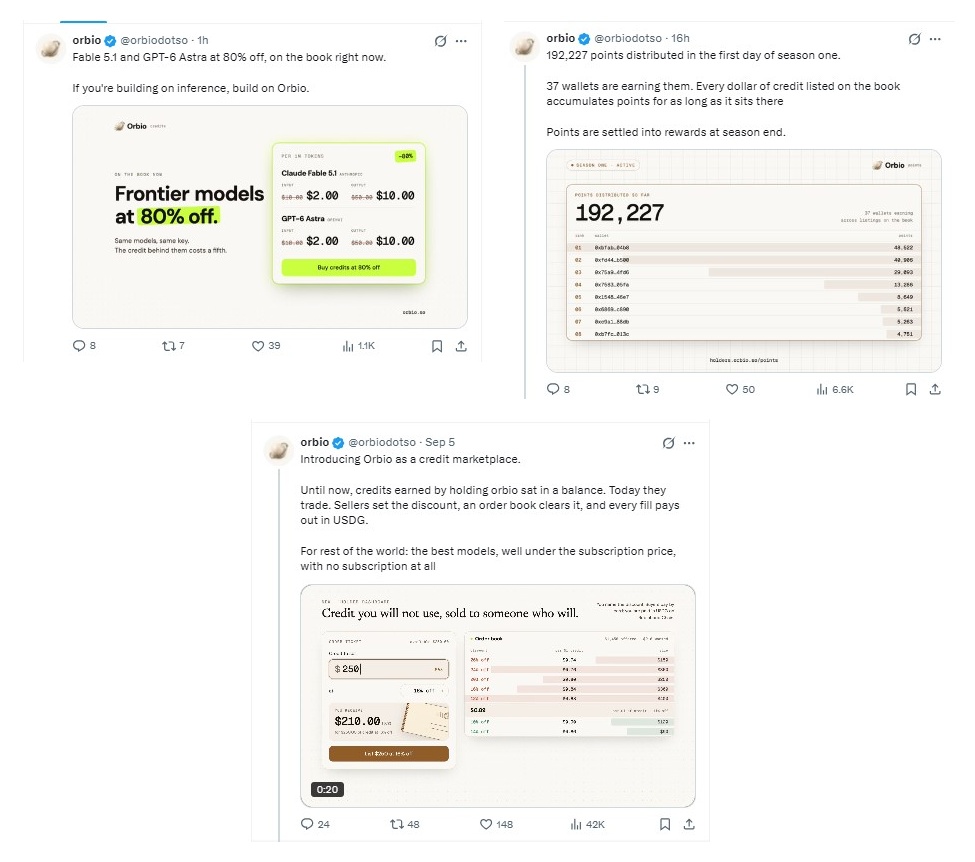
Ecosystem activity like that attracts speculators before it attracts real usage. Social momentum is doing most of the lifting here. Worth watching theevents calendar for anything more concrete.
ORBIO Technical Analysis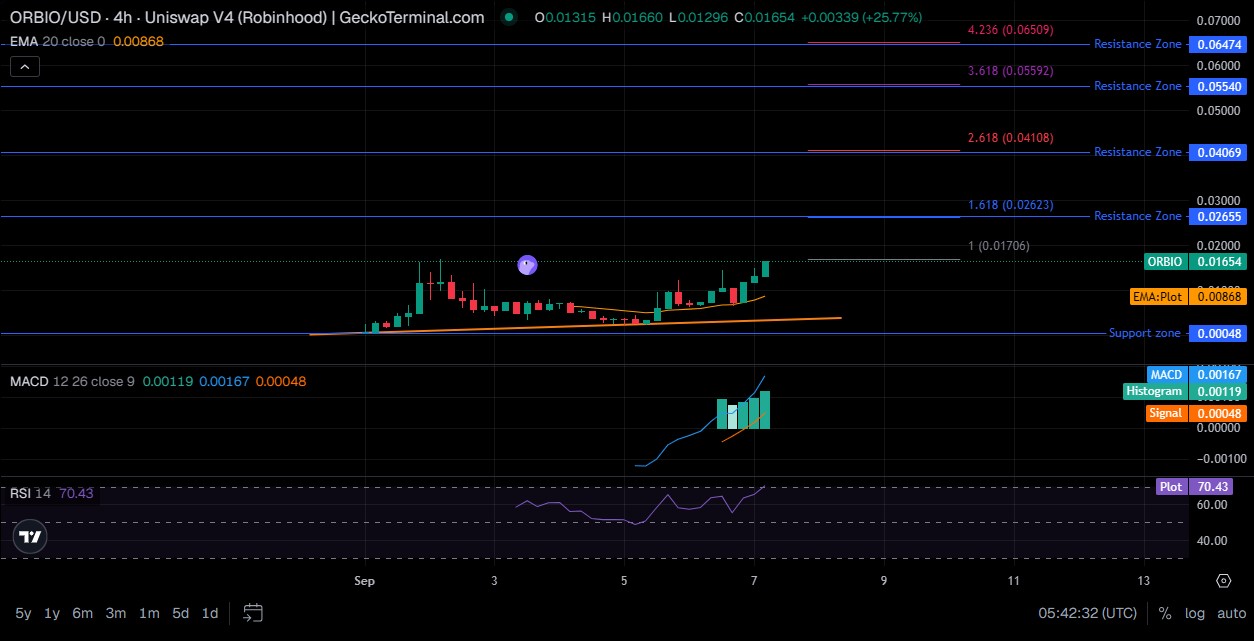
The 4h ORBIO/USD chart shows price climbing off a rounded base near $0.0087 (EMA), with RSI at 70 and a rising MACD histogram, signaling short-term bullish momentum building since Sept 5.
Fibonacci extension
Drawn from the near-zero launch price to the recent high, the fib extension marks resistance at 1.618 ($0.0265), 2.618 ($0.0407), 3.618 ($0.0554), and 4.236 ($0.0647) as upside targets.
$ORBIO Support Levels
Immediate support sits at $0.0130, where recent trading found buyers. Secondary support sits near $0.0090.
The major breakdown level is the launch-day floor near $0.0005. If that goes, the bullish structure is gone.
$ORBIO Resistance Levels
Immediate resistance sits at $0.0265, based on Fibonacci extension work off the launch. Beyond that, the next ceilings sit near $0.0407, then $0.0554, then $0.0647.
RSI and Momentum
RSI (14) reads 70.43 on the four-hour chart. Above 70 counts as overbought, meaning buyers have run ahead of themselves.
That doesn't mean a crash is next. It means chasing here carries more risk than reward.
MACD and Moving Averages
MACD sits at 0.00167, above its signal line at 0.00048, with a positive histogram near 0.00119. A bullish momentum reading in plain terms.
The 20-period EMA sits far below trading, near $0.0087, confirming the short-term trend still points up. But momentum stretched this far rarely stays comfortable for long.
ORBIO Price Prediction for 2026
Bear Case
Support at $0.0130 fails on rising volume, and trading slides toward $0.0090, then $0.0060.
Base Case
Price consolidates between $0.0130 and $0.0200 as the token builds trading history. Volatility cools slowly.
Bull Case
Resistance at $0.0265 breaks on strong volume, opening a path toward $0.040 to $0.055 before year-end.
ORBIO Price Prediction 2027 to 2030
Long-range numbers on a seven-day-old token are scenario planning, not forecasting.
2027 Forecast
Low $0.006, base $0.025, high $0.070. Assumption: the credit-marketplace model finds real users beyond speculators.
2028 Forecast
Low $0.008, base $0.035, high $0.100. Assumption: crypto markets stay in an uptrend and liquidity deepens.
2029 Forecast
Low $0.010, base $0.045, high $0.130. Assumption: utility expands and holder concentration eases.
2030 Forecast
Low $0.012, base $0.060, high $0.170. Assumption: $ORBIO survives multiple cycles without a liquidity crisis.
Can $ORBIO Reach $0.01?
This isn't really a bullish target. At 950 million total supply, $0.01 implies a valuation of roughly $9.5 million.
The current market cap already sits near $15 million. So $0.01 would be a pullback from here, not a breakout.
Can $ORBIO Reach $0.05?
At 950 million tokens, $0.05 implies a valuation of about $47.5 million, roughly three times the current market cap. Possible with real volume growth. Not guaranteed.
Can $ORBIO Reach $0.10?
At 950 million tokens, $0.10 implies a valuation near $95 million, over six times where the token sits today. Saying "ORBIO could reach $0.10" without that context means little.
ORBIO Bull Case vs. Bear Case
Bull Case
A clean break above $0.0265 on rising volume and continued demand for the credit marketplace. That combination pulls in fresh buyers.
Base Case
Sideways trading, cooling volatility, and support around $0.0130 holding through the noise.
Bear Case
Support fails, volume dries up, a wider crypto risk-off move drags everything down. Meme-style tokens fall fastest when sentiment turns.
ORBIO Invalidation Level
The line in the sand: the bullish thesis for $ORBIO breaks if the price loses $0.0090 and fails to reclaim it on real volume within a few sessions.
Below that, the "early breakout" story stops making sense. It becomes a "failed launch pump" story instead.
ORBIO Price Prediction Methodology
This ORBIO price prediction analyzes price structure, trading volume, liquidity depth, RSI, MACD, support and resistance zones, market cap context, Bitcoin’s broader trend, and the strength of key catalysts.
ORBIO Risks
Extremely short trading history, under two weeks
Thin liquidity relative to volume
Whale concentration: The top 10 wallets hold over 36% of the supply, confirmed on theRobinhood Chain explorer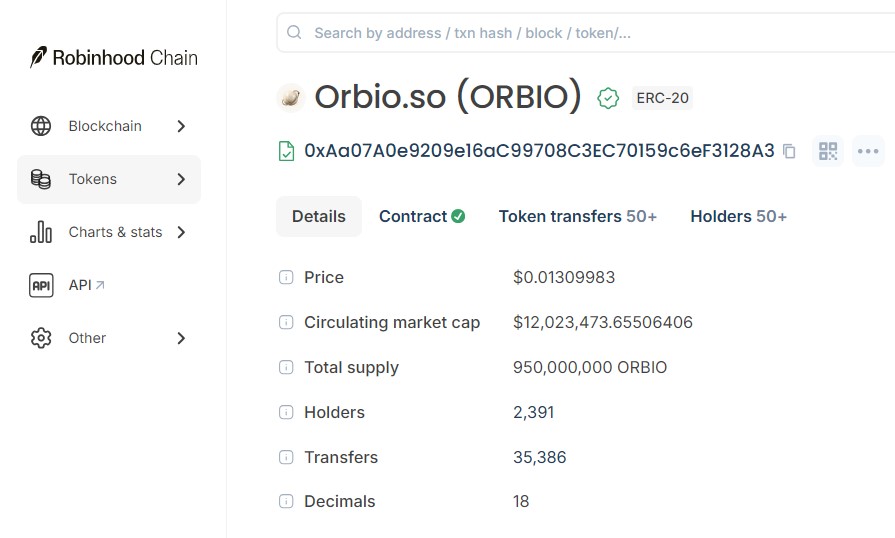
Manipulation risk on a low-liquidity pair
Meme-adjacent, speculation-driven behavior similar to patterns covered inmemecoin news
Exposure to a broader crypto downturn
Risk of a failed breakout above resistance
Fully diluted supply already circulating, so no unlock risk, but no scarcity story either
Trader Takeaway
Bullish above $0.0130. First target $0.0265. Next target $0.0407. Bearish below $0.0090. Invalidation at $0.0060. Wait zone: $0.0130 to $0.0200.
Disclaimer: This article is for informational purposes only and isn't financial, investment, or trading advice. Cryptocurrency markets, especially newly launched tokens like $ORBIO, are highly volatile and carry real risk of loss. Always do your own research before making investment decisions.