This OTC price prediction starts with the numbers. As of 04:30 UTC on September 8, 2026, OTC is trading near $0.0263, up roughly 108%–124% over the past 24 hours depending on the exchange fee
This OTC price prediction starts with the numbers. As of 04:30 UTC on September 8, 2026, OTC is trading near $0.0263, up roughly 108%–124% over the past 24 hours depending on the exchange feed. Over the past seven days the token has swung between $0.001692 and $0.03454, a range that tells you everything about how young this market still is. Volume is heavy. Liquidity is thin. And the token just printed a fresh all-time high before pulling back.
This move isn't happening in a vacuum. OTC Desk integrations went live on a major launcher this week; buy-back activity has reportedly burned over 30% of circulating supply, and traders are chasing momentum on low float. That combination is exactly what produces triple-digit daily swings.
One clarification before anything else. This article covers OTC Desks on Solana, contract MukLDtJ8Cx9DxLbeyLRSWPSposTMWuwHANbuaudpump, not any unrelated token sharing the same ticker. Same three letters, completely different project. Mixing them up is an easy mistake.
OTC Price Prediction Today: What Is Driving the Move?
Price sits around $0.0259–$0.0276across CoinGecko and according to GeckoTerminal, with 24-hour trading volume ranging from $13.1M to $23.7M depending on which venue you check.
Market cap is around $18.8M–$19.6M, against a circulating supply of roughly 710.8M tokens. Liquidity in the main pool is thin, near $747.9K, which explains a lot of the volatility.
Turns out, the catalyst is fairly clear. OTC reward launches went live on a major aggregator this week, and the project's own account posted $114M+ in 24-hour launcher volume. Buy pressure has outpaced sell pressure too, with net buys near $138.8K on the last snapshot.
And there's a supply-side story here. The team claims buy-back and burn activity has reduced circulating supply by over 30% since token generation. Less supply, more demand. That's the setup.
OTC Price Prediction: Key Support and Resistance Levels
OTC Support Levels to Watch
The nearest support sits around $0.0220, the retest zone from the latest breakout candle. Below that, $0.0181 marks the prior swing low from early September.
A deeper support band lives near the 20-period EMA at $0.0126. If that breaks, the next real floor isn't far above the token's launch base.
OTC Resistance Levels to Watch
Immediate resistance is the all-time high near $0.0345, set only hours before this snapshot. A Fibonacci extension cluster lines up right there too, at $0.0353.
Beyond that, the 1.618 extension points to $0.0562, and the 2.618 extension sits at $0.0901. Those are stretch targets, not base-case ones.
The Level That Could Confirm a Breakout
A trade that holds above $0.0290 on rising volume would confirm the breakout structure. Anything that fails there and slips back under $0.0220 puts the bulls back on defense.
OTC Technical Analysis: Is the Rally Still Healthy?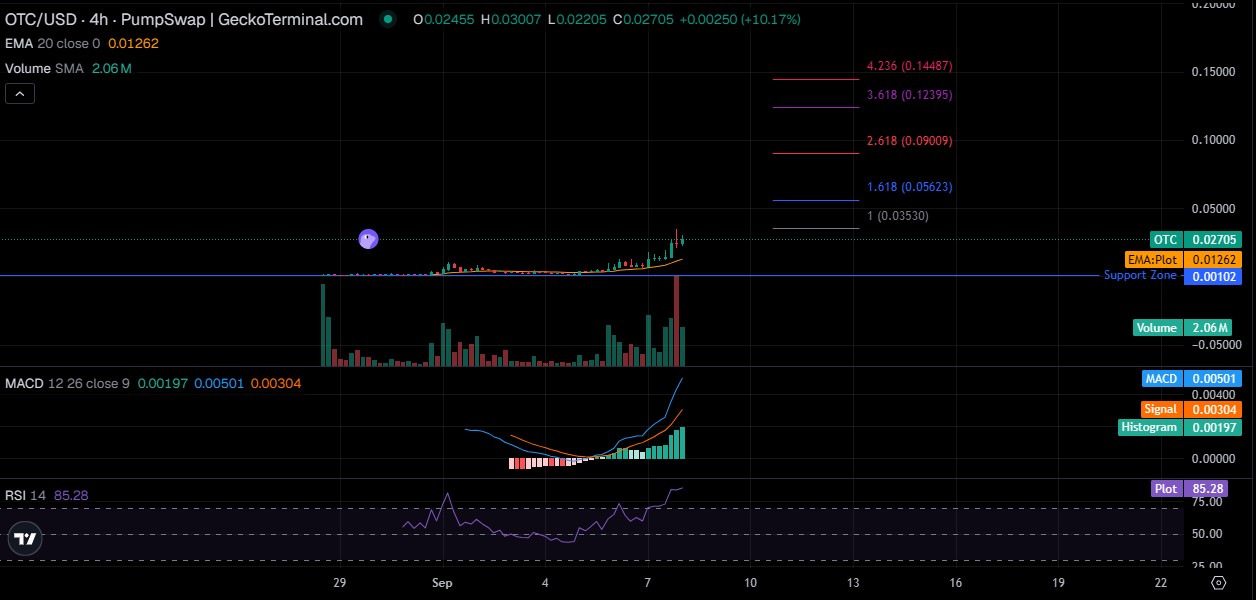
RSI and Momentum
The 14-period RSI reads 85.28. That's deep overbought territory, above the standard 70 line by a wide margin.
When we pulled up the momentum indicators, the RSI reading was the first thing that jumped out. It doesn't mean an immediate reversal. But it does mean upside from here gets harder to sustain without a cooldown first.
Volume Confirmation
Volume is running well above its own moving average, near 2.06M on the SMA reading. That's genuine participation, not a thin wick on empty order books.
The move has real volume behind it. That matters more than the price candle alone.
Trend and Moving Averages
OTC is trading more than double its 20-period EMA of $0.0126. That's a stretched setup by any measure.
Extensions like this tend to snap back toward the average eventually. Not always. But often enough to respect it.
Breakout or Overextension?
Is this a genuine breakout or a parabolic spike that's run too far, too fast? That question is exactly what the next few trading sessions will answer.
Momentum, volume, and a fresh RSI high all point one way. And the size of the extension points the other way. Both things are true at once.
OTC Bull Case, Base Case, and Bear Case
Scenario
Trigger
Target Zone
Invalidation
Bull
Volume-backed breakout above $0.0290
$0.0353–$0.0562
Rejection back below $0.0220
Base
Consolidation between support and resistance
$0.0181–$0.0290
Loss of $0.0181
Bear
Support breakdown with rising sell volume
$0.0126–$0.0181
Reclaim of $0.0220
The base case is where we'd put our weight right now. Overbought conditions plus thin liquidity usually mean a chop before the next leg, not a straight line up. For context on how other low-cap tokens have handled similar setups, broaderprice prediction coverage is worth a look.
OTC Price Prediction for the Next 7 Days
Bullish 7-Day Scenario
A close above $0.0290 with sustained volume opens a path toward the fib cluster near $0.0353–$0.0453. Fresh exchange or launcher integrations could accelerate this.
Base 7-Day Scenario
Sideways trading between $0.0181 and $0.0290 looks like the more probable outcome given the current RSI extreme. Consolidation would actually help the chart.
Bearish 7-Day Scenario
A break under $0.0181 with rising sell volume could send OTC toward $0.0126, the EMA support. That's still well above the token's launch-week lows.
OTC Price Prediction for September and October 2026
A realistic range for the rest of September sits between $0.015 and $0.045, wide because the token is only ten days old. October's range could shift to $0.012–$0.055 depending on whether the current adoption story holds or fades.
Don't treat these as precise numbers. Treat them as guardrails. Any fresh listing or integration announced on thecoin events calendar could shift either range in a hurry.
OTC Price Prediction 2026–2030
OTC is a newly launched and highly volatile Solana token, so anything past this year should be treated as a scenario-based estimate rather than a fixed target. The outlook depends heavily on liquidity, trading volume, holder growth, project adoption, exchange listings, and the broader Solana market.
Year
Bear Case
Base Case
Bull Case
2026
$0.0010–$0.0020
$0.0025–$0.0045
$0.0060–$0.0100
2027
$0.0015–$0.0028
$0.0040–$0.0070
$0.010–$0.018
2028
$0.0020–$0.0035
$0.0055–$0.0095
$0.015–$0.025
2029
$0.0025–$0.0045
$0.0070–$0.012
$0.020–$0.035
2030
$0.0030–$0.0055
$0.0090–$0.016
$0.025–$0.045
OTC Price Prediction 2026
For the rest of 2026, OTC's price action is likely to stay highly sensitive to liquidity and speculative momentum. In the base case, OTC could consolidate within $0.0025–$0.0045 if trading activity stays healthy and the token holds its important support levels. That's below today's price and worth sitting with for a second.
A stronger Solana market, rising liquidity, and additional exchange exposure could push the bull case toward $0.0060–$0.0100. But a sharp decline in volume or heavy selling could send OTC toward the $0.0010–$0.0020 bear-case zone.
OTC Price Prediction 2027
By 2027, the outlook depends more on whether OTC develops sustained ecosystem activity rather than relying only on launch-driven speculation. The base-case range of $0.0040–$0.0070 assumes gradual adoption and healthier market liquidity.
If OTC gains real traction and enters a stronger crypto market cycle, the bull case could reach $0.010–$0.018. Turns out, that's the year where the token either builds a track record or fades into the long tail of forgotten Pump.fun launches.
OTC Price Prediction 2028
OTC could see a wider valuation range in 2028 as its long-term utility, liquidity, and community strength become clearer. The base case places OTC between $0.0055 and $0.0095.
Stronger adoption and sustained demand could support a bull case of $0.015–$0.025. Failure to hold liquidity or user interest, though, would keep the token closer to the $0.0020–$0.0035 bear-case range.
OTC Price Prediction 2029
In 2029, the key question is whether OTC can hold demand through different market conditions. Under the base case, OTC could trade between $0.0070 and $0.012.
A strong ecosystem and favorable crypto market could push the token toward $0.020–$0.035. And weaker adoption could leave it closer to $0.0025–$0.0045.
OTC Price Prediction 2030
The 2030 forecast carries the highest uncertainty because it depends on several factors that can't be known today. In a moderate-growth scenario, OTC could reach the $0.0090–$0.016 range.
A stronger adoption cycle could potentially take OTC toward $0.025–$0.045. But prolonged weakness, low liquidity, or declining demand could keep the token around $0.0030–$0.0055. Wide ranges, on purpose.
What Could Change the OTC 2026–2030 Forecast?
The forecast above should be reassessed if any of these factors materially shift:
Major exchange listings or delistings
Significant changes in DEX liquidity
Sustained increases or decreases in trading volume
Large-holder accumulation or distribution
Growth in OTC Desk activity and adoption
Changes in token supply or burn activity
Strong expansion or contraction in the Solana ecosystem
A major Bitcoin or broader crypto market cycle
Loss or recovery of key technical support levels
Bottom line:the base case should remain the primary reference point, while the bull and bear cases sit there as conditional outcomes. OTC's long-term potential depends less on a single price target and more on whether liquidity, adoption, and demand keep growing together.
What Could Drive OTC Prices Higher?
New exchange listings beyond current venues, viacrypto exchange listing coverage
Expanding OTC Desk adoption and Desk NFT minting
Continued protocol buy-back and burn activity
Growing liquidity depth and holder counts
Broader Solana ecosystem strength andmeme coin sentiment
Favorable Bitcoin market direction
The project's own documentation says OTC is burned to mint desk NFTs and fund rounds that acquire tokenized assets. That's a real mechanism, not just marketing copy.
What Could Push OTC Price Lower?
Thin liquidity near $747.9K, which amplifies every large sell
Whale wallets exiting positions, tracked viaon-chain holder data
A failed breakout above resistance
Loss of the $0.0181 or $0.0126 support zones
Broader Solana or Bitcoin weakness
Fading volume after the initial hype cycle
Whales noticed the move first. They'll notice the exit first too.
OTC Token Utility and Why It Matters
How OTC Desk NFTs Work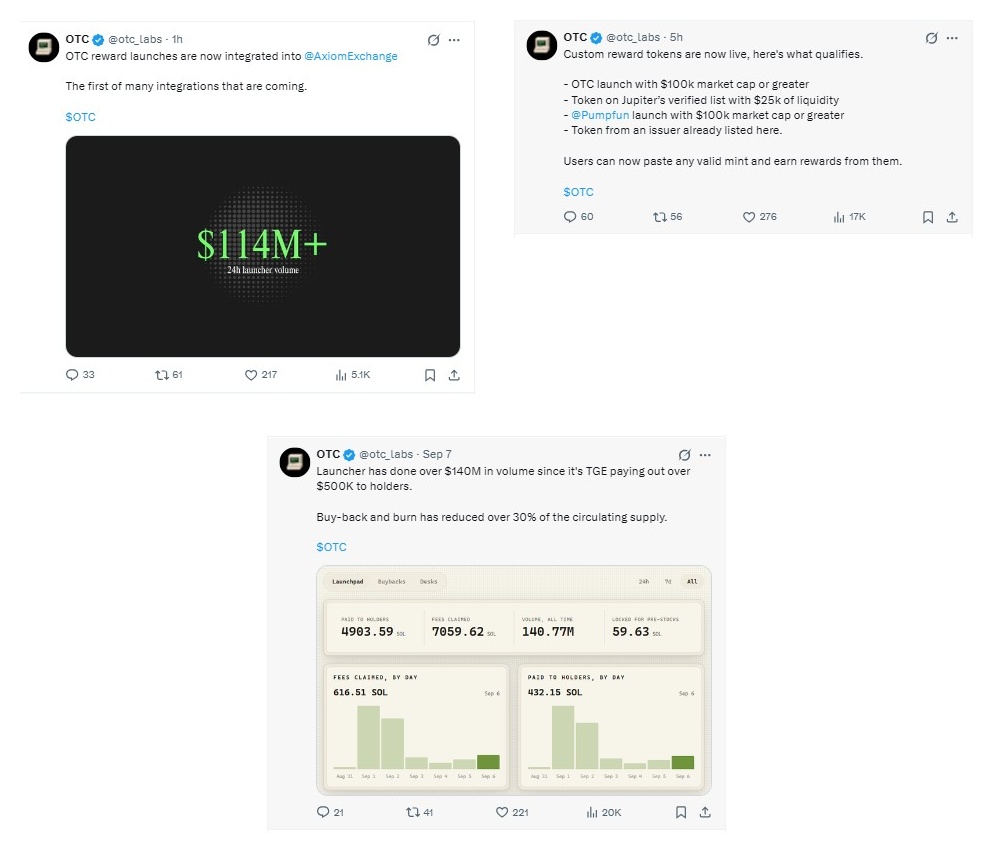
OTC desks are described as NFT-based vehicles tied to over-the-counter exposure, pre-IPO access, and yield generation. Tokens are burned in the process of creating these desks, perproject updates on X.
How OTC Burns Affect Supply
Buy-back and burn activity has reportedly cut circulating supply by more than 30% since the token's launch. Less float, same demand, higher price sensitivity. That cuts both ways.
How Protocol Rounds Generate Asset Exposure
Documentation describes rounds that acquire tokenized real-world assets. This is the piece that separates OTC from a pure meme launch, at least on paper.
OTC On-Chain Data: Holders, Liquidity, and Whale Activity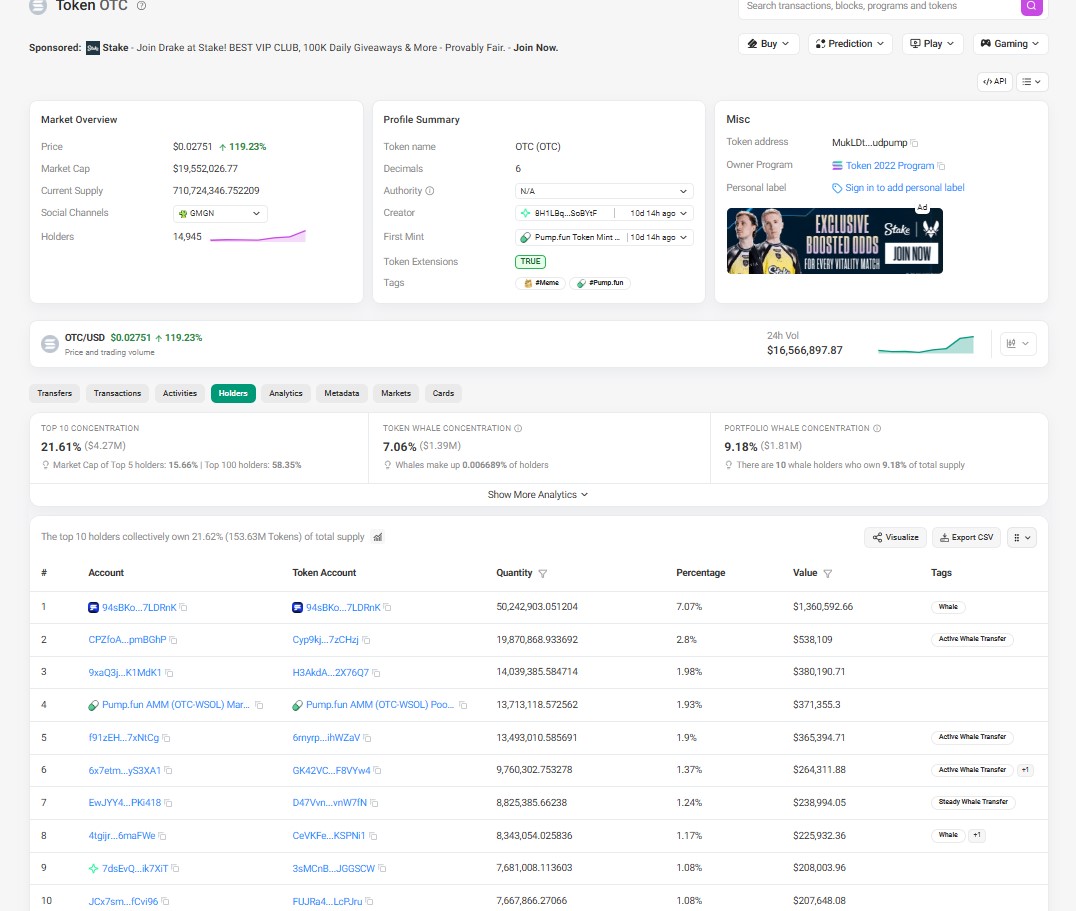
Holder Growth
Holder count has climbed from roughly 9,220 to 14,945 in about a week, a steady upward curve rather than a spike. That's a healthier signal than the price chart alone. Some of that growth likely ties back to reward payouts, similar to what shows up in broaderairdrop activity tracking across Solana launchers.
Liquidity and DEX Depth
Liquidity sits near $747.9K in the main pool, locked according to on-chain trackers. Thin liquidity, though, still means large trades move price fast.
Large Wallet Activity
The top 10 wallets hold between 21.6% and 21.8% of the supply. Whale concentration specifically is closer to 7.1%, spread across a small number of large addresses perholder distribution data.
Buy vs. Sell Pressure
The latest 24-hour window showed roughly 35,069 buy transactions against 33,596 sells, with net buying pressure near $138.8K. Slightly more buyers than sellers. Not overwhelming, but not nothing either.
Is OTC a Meme Coin or a Utility Token?
LBank tags OTC as a MEME token, but the project's own documentation describes a desk and NFT mechanism with real asset exposure. Realistically, it's both right now: a Pump.fun meme launch with an emerging utility layer, and ten days of history isn't enough to call it either extreme.
Is This Solana Token About to 10x or Crash?
A 10x from here means OTC near $0.26, far beyond any fib target in this analysis. The realistic near-term bull case tops near $0.045. With RSI at 85 and thin liquidity, a sharp pullback toward $0.0126–$0.0181 is the bigger risk than a moonshot right now. Realistic, not exciting, but that's the setup.
OTC Trader Takeaway: What to Watch Next
Bullish above: $0.0290
Neutral between: $0.0181–$0.0290
Bearish below: $0.0181
Next upside target: $0.0353
Main risk: overbought RSI meeting thin liquidity
Confirmation signal: volume expansion on a hold above resistance
Disclaimer
This article is for informational purposes only and does not constitute financial, investment, or trading advice. Cryptocurrency markets, especially newly launched tokens like OTC, are highly volatile and can result in significant losses. Always do your own research and consult a licensed financial advisor before making investment decisions.