$PAXG is a token backed one-to-one by physical gold held in vaults, giving holders exposure to gold's price without needing to store the metal themselves. This PAX Gold Price Prediction looks
$PAXG is a token backed one-to-one by physical gold held in vaults, giving holders exposure to gold's price without needing to store the metal themselves.
This PAX Gold Price Prediction looks at where PAXG could head over the next one to two weeks, with the bullish case staying intact as long as the price holds above $4,319, while a slip back under that level would open the door to more downside.
Here's what the data shows.
Market data checked on August 8, 2026, at 09:36 IST.
PAXG Price Prediction Today: Market Overview
Metric
Value
Price
$4,337.85
Market Cap
$1.89B
FDV
$1.89B
24h Volume
$214.4M
Vol/Mkt Cap (24h)
11.33%
Liquidity/Mkt Cap
1.03%
Total Supply
436.55K PAXG
Max Supply
Unlimited
Circulating Supply
436.55K $PAXG
Holders
85.64K
Source: Data from CoinMarketCap as of August 8, 2026, at 09:36 IST. Figures may vary slightly across other tracking websites.
PAXG Liquidation and Volume Data
PAXG future price: Futures Liquidations (Coinglass)
Window
Long Liquidations
Short Liquidations
1h
$416.12
$0
4h
$484.76
$0
12h
$549.66
$0
24h
$11.82K
$150.08K
The liquidation picture shows a clear split between the shorter and longer windows. In the 1h, 4h, and 12h windows, only long positions were liquidated, and the amounts are small, ranging from $416.12 to $549.66.
The 24h window tells a different story: short liquidations jumped to $150.08K against just $11.82K in longs, pointing to a sharp upward move earlier in that period that forced short sellers out of their positions.
The recent shift toward small, long liquidations suggests the market has since cooled off a bit. 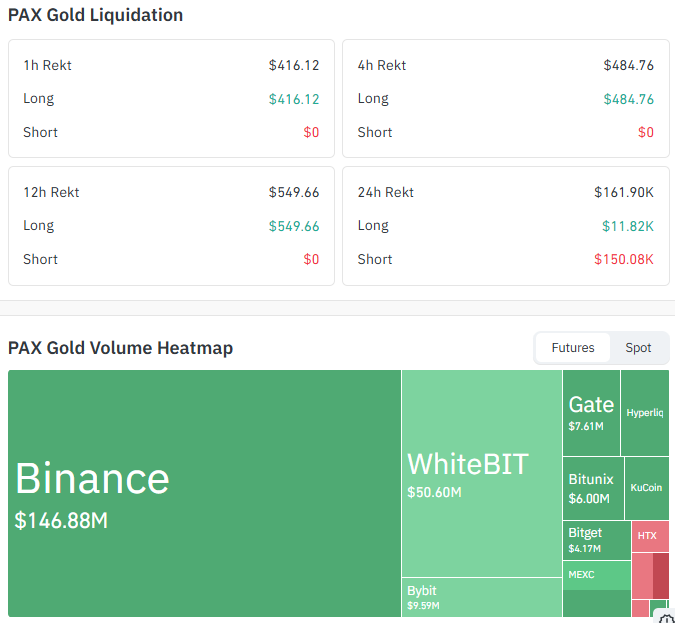
Source: Data From CoinGlass
PAXG future price: Futures Exchange Volume Breakdown
Binance handles the bulk of PAXG futures trading by a wide margin, with $146.88M in volume, more than double the next closest exchange.
WhiteBIT follows at $50.60M, while Bybit, Gate, Bitunix, and Bitget make up a smaller share of the remaining activity.
This concentration on Binance suggests most of the leveraged positioning driving the liquidation moves above is happening there.
Exchange
Volume
Binance
$146.88M
WhiteBIT
$50.60M
NOTE: This is futures liquidation and volume data from Coinglass, kept separate from the CoinMarketCap spot volume figure in the Market Overview table above.
$PAXG Price Prediction Chart: Technical Analysis
Pair: $PAXG/USD · Market: Spot (Crypto) · Exchange: TradingView aggregated feed · Timeframe: 1D · Source: TradingView · Timestamp: August 8, 2026, 09:36 UTC+5:30
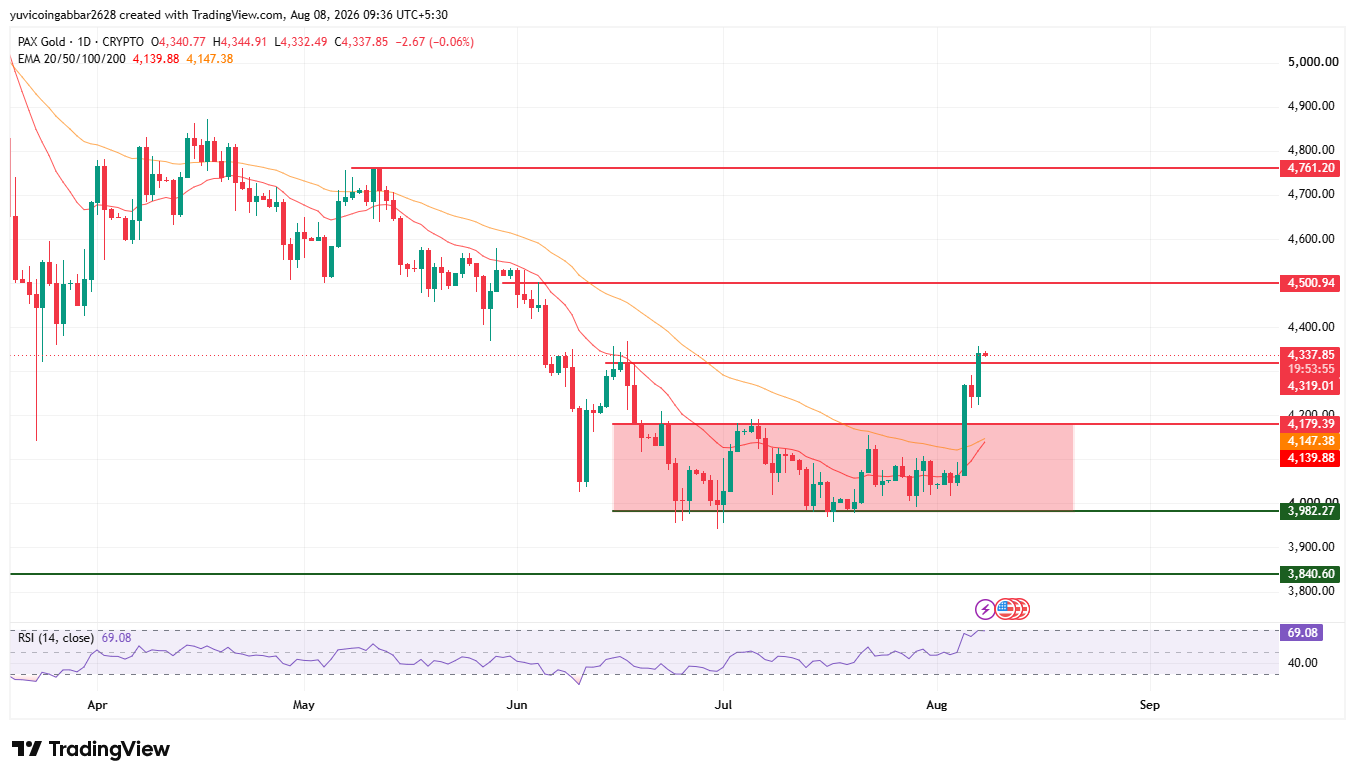
$PAXG is trading at $4,337.85; a sharp rally carried the price out of the sideways range it had held in a downtrend since May.
Price broke above the top of that range near $4,179 and pushed higher, briefly testing the area around $4,319 before easing slightly on this candle.
The EMA (Exponential Moving Average, a momentum indicator that weights recent candles more heavily) cluster sits well below the current price, with EMA 20 at $4,139.88 and EMA 50 at $4,147.38, both still trailing after the sharp move up, which underlines the strength of the breakout.
RSI (Relative Strength Index, a momentum gauge from 0 to 100) reads 69.08, nearing the overbought threshold of 70 but not there yet.
If the price holds, it can continue toward the upper levels. If it breaks below $3,982, we could see further downside levels.
There is no bearish signal as long as the price is trading above the EMA 20 and EMA 50. While it holds above these EMAs, the bias remains bullish.
Support and Resistance Levels
Level Type
Price
Resistance 2
$4,761.20
Resistance 1 (nearest)
$4,500.94
Immediate Price Reference
$4,337.85
First Support
$4,319.01
Deeper Support
$4,179.39
Structural Floor 1
$3,982.27
Structural Floor 2
$3,840.60
EMA Levels
EMA
Price
EMA 20
$4,139.88
EMA 50
$4,147.38
PAXG Forecast: Bull Case vs. Bear Case
$PAXG price target 2026 bull case: If the price sustains at the current level and breaks the upper resistance, the upper levels to watch are $4,500.94 and $4,761.20.
$PAXG price target 2026 Bear case: If it breaks below the $4,319.01 support instead, the price can move toward the lower levels at $4,179.39 and $3,982.27.
$PAXG price target 2026: Can PAXG Reach $4,761.20?
$4,761.20 is the highest resistance level marked on the chart. Reaching it would require $PAXG to first clear the nearest resistance at $4,500.94 and hold above it, a multi-stage move rather than a single leg, especially with RSI already close to overbought territory.
What Could Invalidate the Bullish Setup?
A rejection at the nearest resistance near $4,500.94 followed by a close back below the first confirmed support at $4,319.01 would put the breakout in question.
A deeper break below $4,179.39 and the structural floor at $3,982.27 would put $PAXG back inside the range it just broke out of.
$PAXG Price Prediction 2026: Expert View
According to CoinGabbar analysts, the breakout above the May-to-August range and the RSI reading near 69 point to strong short-term momentum, though the indicator sitting just under overbought levels means a pause or pullback would not be unusual.
The liquidation data shows the shift clearly: the 24h window saw far heavier short liquidations at $150.08K against just $11.82K in longs, consistent with a squeeze that pushed price through resistance, while the more recent 1h, 4h, and 12h windows show only small long liquidations, suggesting the move has cooled rather than reversed.
The $4,319.01 to $4,500.94 zone is the key battleground going forward.
PAXG Price Prediction: Data Sources
Price, EMA, and RSI data referenced from a 1D PAXG/USD chart via TradingView, timestamped August 8, 2026, 09:36 UTC+5:30.
Market cap, FDV, volume, and supply data referenced from CoinMarketCap.
Liquidation and futures exchange volume data referenced from Coinglass.
Disclaimer: This piece is for informational purposes only and isn't financial advice. The levels and scenarios above are based on technical chart analysis and publicly available data at the time of writing, and crypto markets can move sharply within hours, so past patterns don't guarantee future outcomes. It's worth doing independent research and considering your own risk tolerance before acting on any of the levels discussed here.