$PAXG price prediction: PAX Gold Price Today PAXG is trading near $4,257 on August 7, 2026, holding above key support after a falling wedge breakout earlier this week. A high-impact US Non-Fa
$PAXG price prediction: PAX Gold Price Today
PAXG is trading near $4,257 on August 7, 2026, holding above key support after a falling wedge breakout earlier this week.
A high-impact US Non-Farm Payroll (NFP) report due later today could decide whether this PAX Gold price prediction holds, with the token either defending this level or sliding toward the $4,141 support zone.
The release is forecast at 85K jobs against a previous print of 57K.
Key Takeaways
PAXG trades near $4,257, holding above the falling wedge breakout from August 6, 2026.
Today's NFP release is forecast at 85K jobs versus a previous 57K, with the outcome likely to set direction for the token in the short term.
A weak NFP print favors gold and could push price toward $4,362, then $4,581 and $4,758.
A strong NFP print favors the dollar and could pull the price back to the $4,141 EMA cluster, then $3,973 to $3,939.
On the last release, July 2, 2026, a miss of 57K against a 114K forecast moved gold roughly 2% to 2.5% higher.
RSI sits at 64.75, bullish but not yet overbought, while a 20 and 50 EMA bullish crossover is still forming and not yet confirmed.
PAX Gold Price Prediction: Current Market Overview
At the time of writing, PAX Gold ($PAXG) is trading at $4,256.55, up 0.12% over the past 24 hours, according to Coinglass data checked on August 7, 2026, at 10:15 IST.
Market cap stands at $1.85 billion, open interest sits at $189.70 million, and combined spot and futures 24-hour volume comes to roughly $227 million, made up of $199.82 million in futures volume and $27.41 million in spot volume.
The token is a tokenized commodity backed one-to-one by physical gold, with each unit representing one fine troy ounce of London Good Delivery gold held in secure vaults.
Circulating supply stands at 436.55K, matching total supply, with no maximum cap.
This PAX Gold price prediction looks at whether the token can defend its recent breakout as a major US jobs report lands later today.
Why Today's NFP Data Matters for the Gold-Backed Token
The Non-Farm Payroll (NFP) report, released monthly by the US Bureau of Labor Statistics, measures the change in employed people across the US economy.
As of press time, ForexFactory lists the print as forecast at 85K jobs, up from a previous reading of 57K, with the unemployment rate seen as steady at 4.2%.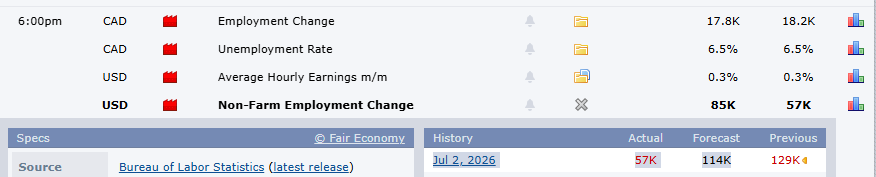
A stronger-than-expected print points to a resilient labor market, which can reduce Fed rate cut bets, strengthening the dollar and weighing on gold. A weaker print does the opposite.
The last release is a useful reference point. On July 2, 2026, the actual print came in at 57K, well short of the 114K forecast, and gold moved roughly 2% to 2.5% higher on the miss.
This token's short-term direction today is closely tied to how the NFP data compares against this forecast.
Source: ForexFactory economic calendar, checked August 7, 2026, 09:42 IST.
PAXG Technical Analysis: Falling Wedge Breakout
The daily chart for the pair, tracked on TradingView as of August 7, 2026, 09:56 IST, shows a structure building since a peak near $5,600 earlier in the cycle.
On March 19, 2026, the 20 and 50 EMA (Exponential Moving Average, a trend line weighting recent price action more heavily) formed a bearish crossover, confirming the downtrend already in place. 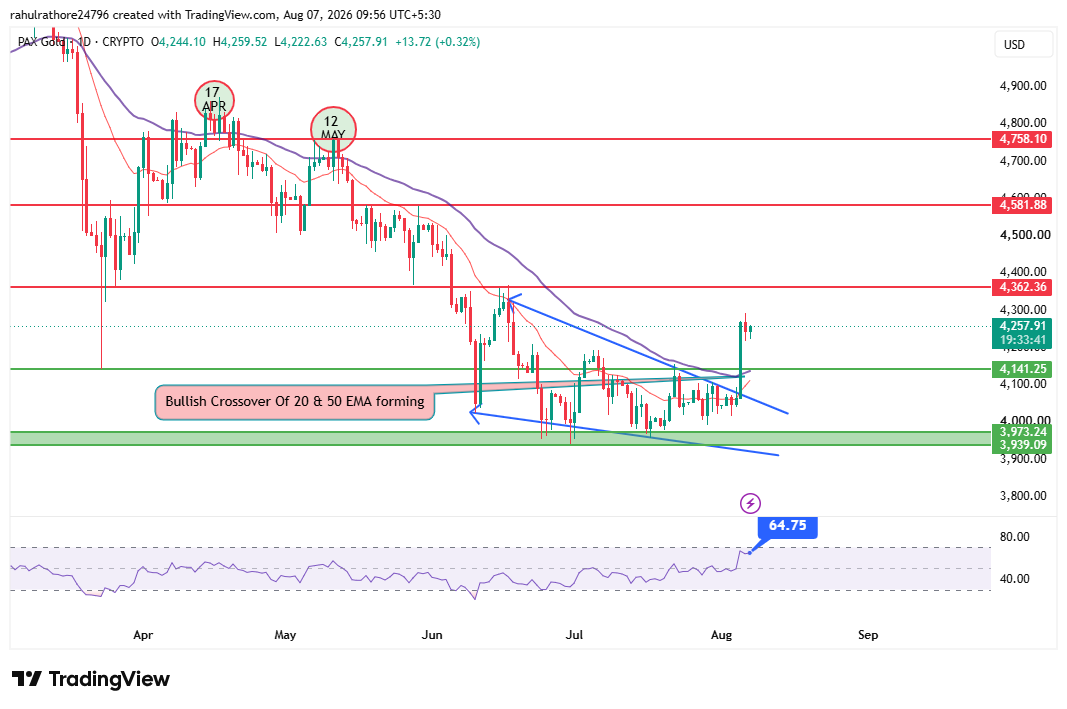
The price fell to the $4,140 level in line with this signal.
Price then attempted to reclaim the EMA cluster twice, on April 17 and again on May 12, 2026. Both attempts failed and reversed lower, eventually printing a new lower low.
After that second failed attempt, the token entered a falling wedge, a pattern of converging downward trendlines typically seen as a bullish reversal setup once broken upside.
Price tested a breakdown of the wedge twice but reversed both times, using the $3,973 to $3,939 zone as support.
On August 6, 2026, the price broke out of this wedge to the upside and now trades in the $4,250 range. Alongside this move, the 20 and 50 EMA are showing early signs of a bullish crossover.
If confirmed, this would support a broader trend shift, opening the path toward the resistance levels below.
RSI, a momentum gauge scaled from 0 to 100, currently reads 64.75, placing the token in bullish territory without yet reaching overbought conditions above 70.
Source: TradingView, PAXG/USD daily chart, checked August 7, 2026, 09:56 IST.
Methodology
The price levels in this PAX Gold price prediction come from three inputs. Support and resistance zones are read off the daily PAXG/USD chart on TradingView, based on prior swing highs, swing lows, and the current EMA cluster.
Market data, including price, market cap, open interest, and volume, is sourced from Coinglass.
Macro context, including the NFP forecast, previous reading, and release timing, is sourced from the ForexFactory economic calendar.
All figures were checked on August 7, 2026, and are subject to change once the NFP data is released later today.
PAX Gold Price Prediction: Bear, Base, and Bull Case Scenarios
The table below outlines potential price paths depending on how the NFP data lands later today and whether the EMA crossover confirms.
ScenarioPrice TargetKey AssumptionInvalidation ConditionBull Case$4,362 to $4,758NFP misses forecast, the US dollar weakens, and the EMA crossover confirms the breakout.A daily close back below
$4,141 would invalidate the bullish structure.Base Case$4,141 to $4,362NFP prints close to expectations, resulting in a muted reaction from the US dollar.A breakout above or below this range would invalidate the range-bound outlook.Bear Case$4,141 down to $3,939NFP beats forecasts, the US dollar strengthens, and the falling wedge breakout fails.A daily close back above
$4,362 would invalidate the bearish outlook.
In the bull case, a confirmed EMA crossover combined with a soft NFP print could push price toward the $4,362 resistance first, with $4,581 and $4,758 as extended targets if buying pressure continues.
In the bear case, a hot NFP print raises the odds that price revisits the EMA cluster near $4,141 as its first support, with the $3,973 to $3,939 zone as the next line of defense if selling accelerates.
Futures and Open Interest Data
Open interest on PAXG futures stood at $189.70 million as of August 6, 2026, 05:30 UTC, down sharply from a peak above $500 million earlier this year.
This decline alongside falling spot volume suggests reduced speculative positioning heading into today's NFP release. 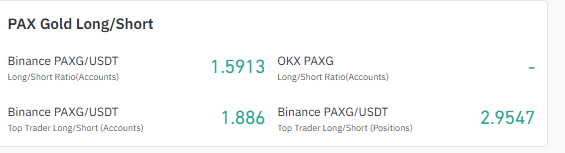
Liquidation activity on futures over the past 24 hours is a very small amount in dollar terms, so it does not carry a meaningful signal here. Source: Coinglass, liquidation data.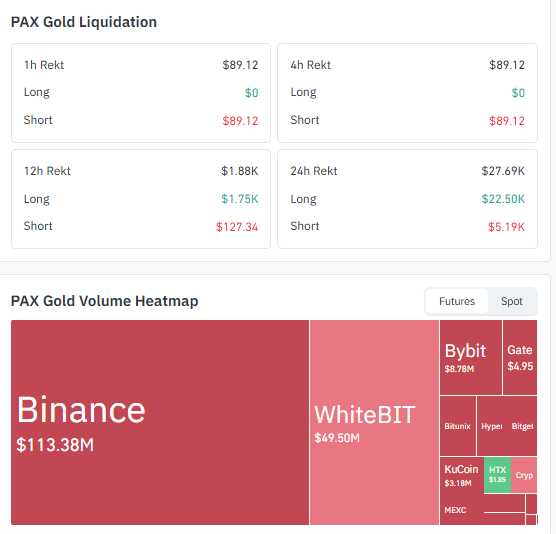
Trader positioning shows more accounts leaning long than short. On Binance, the long to short ratio by accounts stood at 1.59, while top traders were positioned even more heavily long, at 2.95 by position size.
Source: Coinglass, long/short ratio data, checked on August 7, 2026.
Expert Opinion
According to CoinGabbar analysis, the setup into today's NFP release places this gold-backed token at a genuine inflection point rather than a routine trading day.
The falling wedge breakout and early EMA crossover give the bulls a technical case, but that case has not yet been tested against a high impact macro catalyst.
Given trader positioning already leans long on major exchanges, a hot NFP print could trigger a sharper downside reaction than usual if long positions get squeezed. A soft print, on the other hand, could accelerate the breakout rather than merely confirm it.
This PAX Gold price prediction is an independent analysis. CoinGabbar has no sponsorship, affiliate, or promotional relationship with Paxos or the token.
Glossary
Non-Farm Payroll (NFP): A monthly US Bureau of Labor Statistics report tracking the change in employed people across the economy, widely watched for its effect on the dollar and gold.
Exponential Moving Average (EMA): A trend indicator that weights recent price action more heavily than older data, often used to spot crossovers and trend shifts.
Relative Strength Index (RSI): A momentum gauge scaled from 0 to 100 that flags overbought conditions above 70 and oversold conditions below 30.
Falling Wedge: A chart pattern formed by two downward sloping, converging trendlines, typically viewed as a bullish reversal setup once price breaks above the upper line.
Open Interest: The total number of outstanding futures contracts on an asset that have not been settled, often used as a gauge of speculative positioning.
Disclaimer: This article is for informational purposes only and should not be considered financial advice. Cryptocurrency and gold-backed token prices are volatile and can be influenced by macroeconomic data, regulatory changes, and market sentiment. Readers should conduct their own research and consult a qualified financial advisor before making investment decisions. Past performance and technical patterns do not guarantee future results.