$PRL is a crypto token that has been trading inside a well-defined descending channel over the past several weeks. This Pearl Price Prediction looks at where PRL could head over the next one
$PRL is a crypto token that has been trading inside a well-defined descending channel over the past several weeks.
This Pearl Price Prediction looks at where PRL could head over the next one to two weeks after breaking down from that channel, with the bearish case staying in play as long as price trades below $0.28273746, while a reclaim of that level would open the door to a recovery.
Here's what the data shows.
Market data checked on August 8, 2026, at 14:43 IST.
PRL Price Prediction Today: Market Overview
Metric
Value
Price
$0.24808206
24h Change
-5%
Market Cap
$61.242M
FDV
$504.259M
24h Volume
$364,671
Circulating Supply
255.046M PRL
Total Supply
2.1B $PRL
Max Supply
2.1B $PRL
Source: Data from CoinGecko as of August 8, 2026, at 14:43 IST. Figures may vary slightly across other tracking websites.
PRL Price Prediction Chart: Technical Analysis
Pair: PEARL/USDT · Market: Spot (Crypto) · Exchange: CoinEx · Timeframe: 1D · Source: TradingView · Timestamp: August 8, 2026, 14:43 UTC+5:30
$PRL has been sliding lower inside a descending parallel channel since late June, and in early August the price broke down below the lower boundary of that channel.
Since the breakdown, $PRL has been consolidating in a tight range between roughly $0.24808 and $0.282737, unable to reclaim the channel it fell out of.
RSI (Relative Strength Index, a momentum gauge from 0 to 100) reads 31.76, nearing oversold territory and reflecting the persistent selling pressure.
The EMA (Exponential Moving Average, a momentum indicator that weights recent candles more heavily) sits well above the current price, with EMA 20 at $0.30145406 acting as resistance above the current consolidation zone.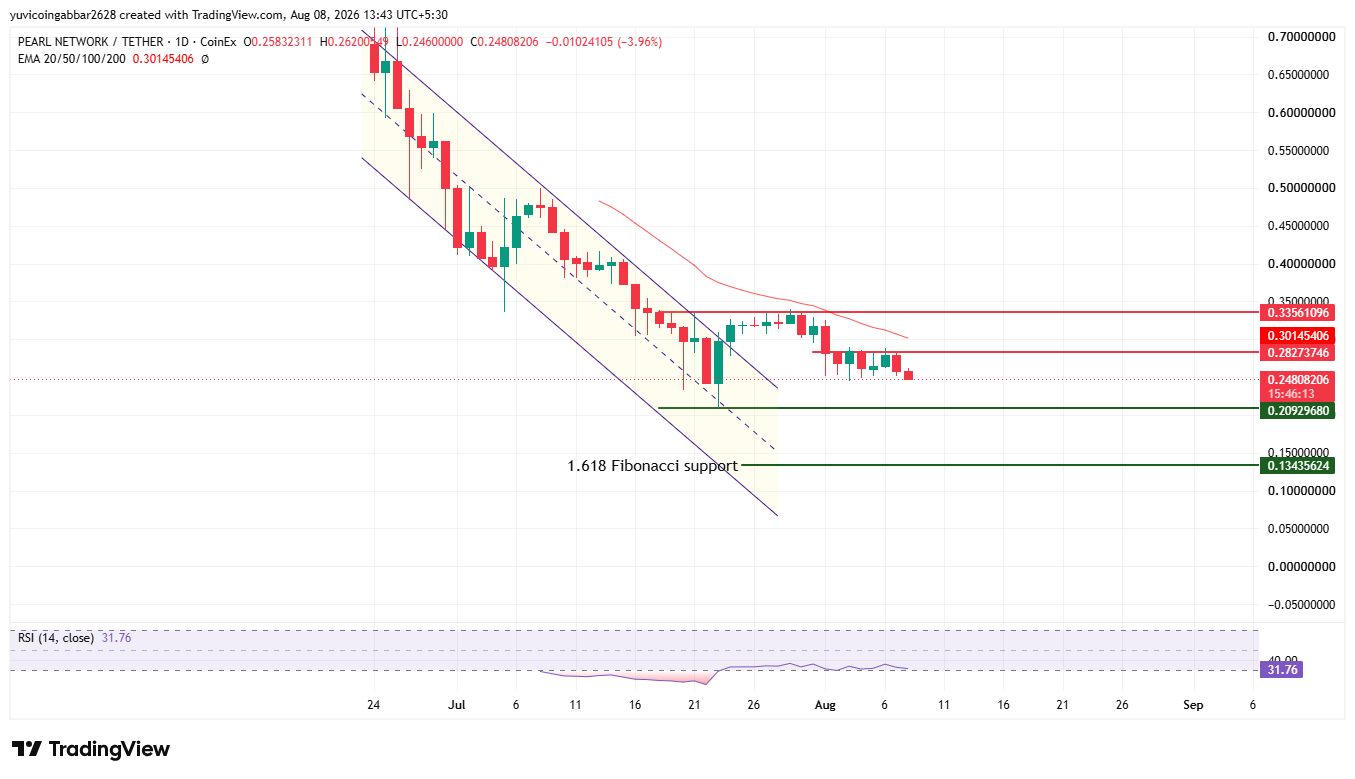
$PRL token forecast: Support and Resistance Levels
Level Type
Price
Resistance 2
$0.33561096
Resistance 1 (nearest)
$0.28273746
Immediate Price Reference
$0.24808206
First Support
$0.20929680
Deeper Support (1.618 Fibonacci)
$0.13435624
PRL token forecast: EMA Levels
EMA
Price
EMA 20
$0.30145406
$PRL Forecast: Bull Case vs. Bear Case
$PRL price target Bull case: If the price sustains at the current level and breaks the upper resistance, the upper levels to watch are $0.28273746 and $0.33561096.
$PRL price target Bear case: If it breaks below the $0.20929680 support instead, the price can move toward the lower level at $0.13435624.
$PRL price target Can PRL Reach $0.33561096?
$0.33561096 is the highest resistance level marked on the chart.
Reaching it would require $PRL to first reclaim the EMA 20 level near $0.30145406 and clear the nearer resistance at $0.28273746, a multi-stage recovery rather than a quick bounce, especially with the token still trading below its broken channel.
What Could Invalidate the Bullish Setup?
A rejection at the nearest resistance near $0.28273746, followed by a close back below the first confirmed support at $0.20929680, would keep the bearish structure intact.
A confirmed break below the 1.618 Fibonacci support at $0.13435624 would suggest the selloff still has room to extend.
PRL Price Prediction: Expert View
According to CoinGabbar analysts, the break below the multi-week descending channel and RSI sitting near 31.76 points to a market that remains under pressure, though the pace of the decline has slowed since the breakdown, with price consolidating rather than extending lower.
EMA 20 sitting well above current price at $0.30145406 confirms the broader trend is still down.
The $0.20929680 to $0.28273746 range is the key zone to watch; holding above it keeps the current consolidation intact, while losing it would expose the deeper Fibonacci support at $0.13435624.
PRL Price Prediction: Data Sources
Price, EMA, and RSI data referenced from a 1D PEARL/USDT chart via TradingView on CoinEx, timestamped August 8, 2026, 14:43 UTC+5:30.
Market cap, FDV, volume, and supply data referenced from CoinGecko.
Disclaimer: This piece is for informational purposes only and isn't financial advice. The levels and scenarios above are based on technical chart analysis and publicly available data at the time of writing, and crypto markets can move sharply within hours, so past patterns don't guarantee future outcomes. It's worth doing independent research and considering your own risk tolerance before acting on any of the levels discussed here.