PENGU breakout follows months of consolidation, supported by rising volume and reclaimed resistance levels. Price faces pressure near $0.01, with holding above support seen as critical. Volum
- PENGU breakout follows months of consolidation, supported by rising volume and reclaimed resistance levels.
- Price faces pressure near $0.01, with holding above support seen as critical.
- Volume expansion confirms participation, though short-term pullback risks remain after rapid surge.
PENGU breakout signals a shift after prolonged consolidation, with price reclaiming resistance levels amid rising volume and renewed market participation, setting the stage for a potential continuation phase.
Breakout Structure and Resistance Reclaim
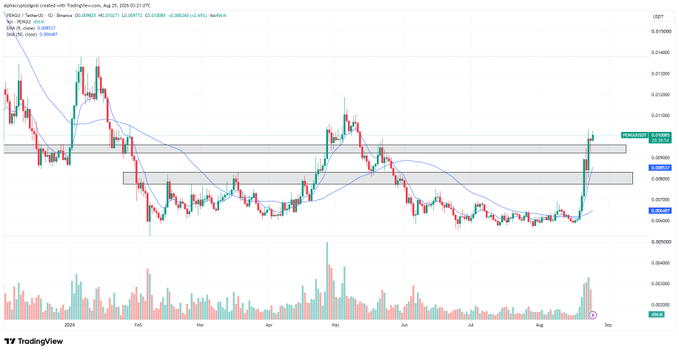
Price action shows a decisive move above multiple horizontal resistance zones. These levels previously capped upside attempts during earlier trading phases. The breakout reflects renewed strength after months of constrained movement.
A tweet from Alpha Crypto Signal notes similarities with LINK structure. The comparison focuses on reclaiming resistance as future support zones. This framework often marks early stages of trend transitions.
Source:
XThe breakout candle stands out due to its strong body formation. Minimal wicks indicate sustained buying pressure throughout the session. Such candles typically reflect conviction rather than short-term speculation.
Volume expansion accompanied the breakout move across key resistance levels. Higher participation suggests broader market interest in the asset. This dynamic strengthens the credibility of the upward move.
Volume Expansion and Momentum Shift
Volume remained relatively subdued during the earlier consolidation phase. Trading activity picked up sharply during the breakout session. This shift reflects increased engagement from market participants.
Reports indicate trading volumes surged during the recent rally period. This aligns with observed spikes in the chart’s volume profile. Such increases often accompany structural market changes.

The moving average previously acted as dynamic resistance for months. Price struggled to sustain levels above this trend indicator earlier. The breakout now places price firmly above that average.
The short-term outlook is bearish to bullish. But rapid rise poses the danger of short term fatigue. Markets often pause or retrace after sharp vertical advances.
Key Levels and Short-Term Outlook
The $0.01 level remains a key psychological resistance area. Price briefly moved above it before encountering selling pressure. This level continues to act as a near-term ceiling.
Support now forms near the reclaimed resistance zones below current price. Holding above these levels would reinforce the breakout structure. Failure to hold may signal weakening momentum.
The recent pullback has been more of a controlled rather than an aggressive one. Slow declines can signal profit-taking and not panic selling. This behavior keeps the broader structure intact for now.
The next phase depends on how price reacts near support levels. Sustained buying interest could drive another upward leg. Conversely, declining volume may lead to further consolidation.