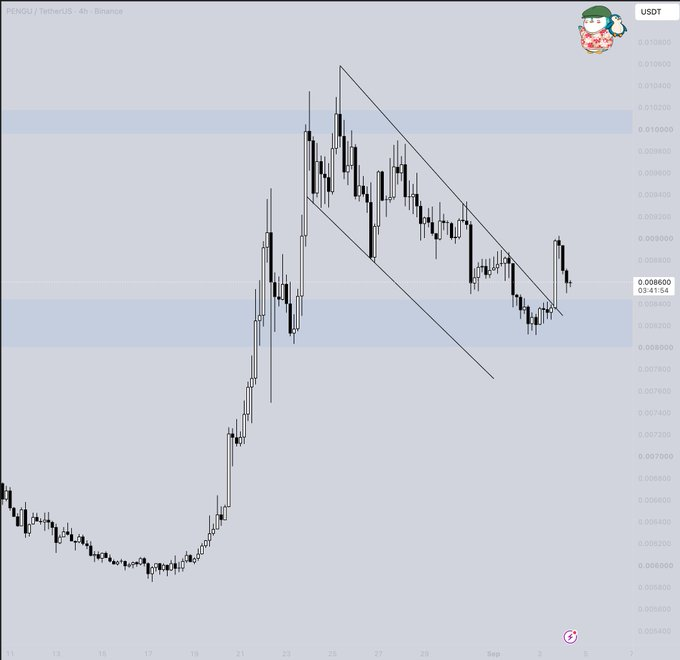
PENGU breakout holds above $0.0082, keeping the retest active while buyers target $0.0090 and the earlier $0.0102 peak again soon. Short-sale volume has cooled below one million, while total
- PENGU breakout holds above $0.0082, keeping the retest active while buyers target $0.0090 and the earlier $0.0102 peak again soon.
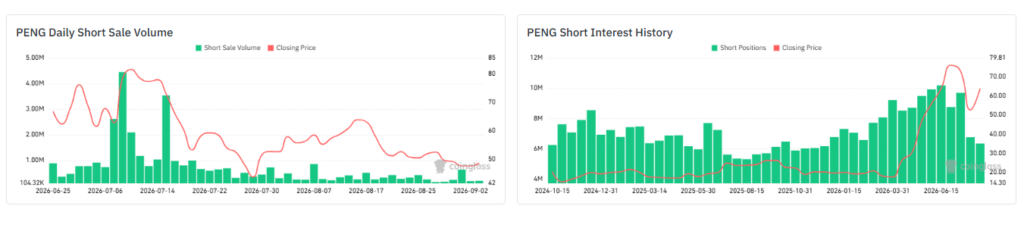
- Short-sale volume has cooled below one million, while total short positions remain above 11 million on the latest chart data available.
- A decisive break above $0.0102 would mark a higher high and strengthen the recovery structure shown across the four-hour chart ahead.
PENGU breakout puts support under focus as buyers assess resistance. The retest tests whether that former ceiling can become firm support for further gains. That keeps buyers closely engaged.
PENGU Holds the Breakout Retest
The 4-hour time frame chart shows that PENGU is recovering from a long-term uptrend with resistance in a descending direction. Price had fallen from roughly $0.0100 toward the $0.0080-$0.0083 support area. The recent change put the trendline into a downtrend.
Source:
XThat shift followed repeated failures beneath descending resistance during the earlier correction. Now, buyers face a test around the former breakout area and nearby support. The PENGU breakout remains active while price stays above that region.
Scott described the move as a classic break-and-retest setup in a daily update. His view focused on defending support before another attempt toward recent highs. The current chart shows price around $0.00852 after reaching near $0.0090.
That retreat keeps the retest active rather than confirming a completed continuation. The $0.0082-$0.0084 range is still at the center of the near-term pattern. A sustained hold there would keep the recent breakout technically intact.
Resistance Levels Define the Next Move
Above the current range, $0.0090-$0.0095 forms the next resistance band. Price must clear that area before challenging the earlier $0.0100-$0.0102 peak. That previous peak remains the clearest reference for a broader trend change.
A break higher from it will set up a higher high on the 4 hour chart. Broader resistance levels sit near $0.0119, $0.0138, and $0.0172. Those levels become relevant only if the current breakout continues holding.
The short-volume chart adds another dimension to the market structure. Daily short volume surged near July 9, reaching roughly 4.5 million. Another spike appeared around July 14, while price remained under pressure.
Since then, daily short volume has generally fallen below one million. Several recent sessions show only a few hundred thousand shares traded short. That decline indicates less aggressive fresh short selling during the later period.
Short Interest Shapes the Setup
However, lower daily short volume alone does not confirm a bullish reversal. The longer term short-term chart is showing a different picture.In most of 2024 and 2025, shorts went up to around 6-8 million.
Source:
CoinglassThis expanded in 2026, and eventually rose to more than 11 million. It is the highest short-position area indicated on the chart. Elevated short positioning can amplify moves when bearish positions begin closing.
Yet renewed selling could still return if PENGU loses its breakout zone. The market therefore remains centered on support retention and resistance recovery. A move back below $0.0082 would weaken the current breakout structure.
Conversely, holding support while reclaiming $0.0090 would strengthen continuation prospects. Clearing $0.0100-$0.0102 would provide the next major technical confirmation. Price action around these levels will determine whether recovery momentum persists.