PENGU climbed from $0.0080 to around $0.0110, with $0.0110-$0.0116 now acting as immediate resistance. Ali Charts highlights weekly buy signals from TD Sequential, Parabolic SAR and SuperTren
- PENGU climbed from $0.0080 to around $0.0110, with $0.0110-$0.0116 now acting as immediate resistance.
- Ali Charts highlights weekly buy signals from TD Sequential, Parabolic SAR and SuperTrend indicators.
- A move above $0.025 could bring the $0.045 channel boundary into focus, while $0.0090-$0.0080 remain key support.
PENGU jumped above $0.01 with exchange flows turning volatile. Analyst Ali Charts identified several weekly indicators pointing higher, while the latest chart shows price near $0.0110. The move also brought the $0.025 and $0.045 channel levels into focus as Ali Charts’ technical targets.
Weekly Indicators Point To A Breakout
Ali Charts said Bollinger Bands are squeezing on PENGU’s weekly chart. The upper and lower bands have contracted, showing low volatility before the latest price expansion. The Tom DeMark Sequential produced two weekly buy signals.
https://twitter.com/alicharts/status/2102150992976310309?s=20
A 9 setup appeared first, followed by a Combo 13 signal. Together, those readings can indicate a new nine-candle bullish countdown. Meanwhile, the Parabolic SAR flipped bullish, with its dots moving below PENGU’s price.
The SuperTrend indicator also turned into a buy signal. Ali Charts noted that a similar weekly signal previously preceded a 1,156% rally.
PENGU Price Breaks Above $0.01
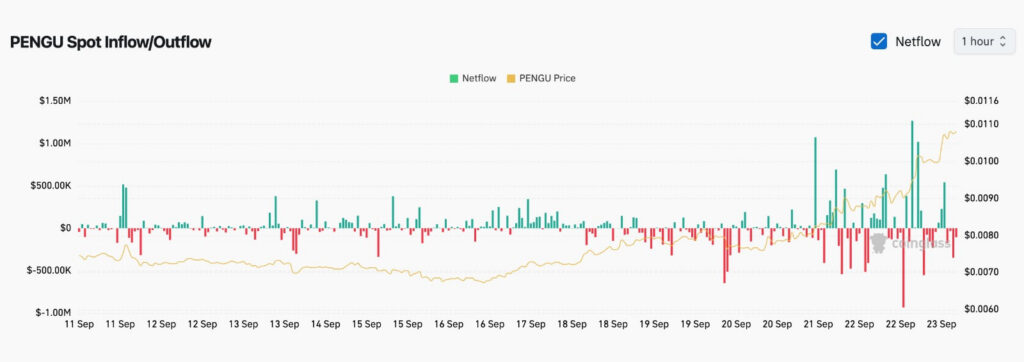
The chart shows PENGU breaking above $0.0080 around September 21. Price then moved through $0.0090 and $0.0100 before reaching approximately $0.0110 on September 23. The move followed several smaller exchange-flow readings earlier in September.
Source:
Coinglass
Negative spikes reached roughly $500,000 to $600,000, while a September 20 outflow approached $650,000. After the breakout began, positive inflow spikes grew sharply. Individual green bars reached approximately $1 million, $1.1 million and $1.25 million.
However, outflows also increased. Red spikes approached $500,000 and nearly $1 million on September 22, showing strong two-way exchange activity.
Analyst Watches Higher PENGU Price Levels
Ali Charts said PENGU remains inside a parallel channel. The midpoint near $0.025 represents his first target if price breaks higher. A move through that level would bring the upper channel boundary near $0.045 into focus.
Ali Charts estimated that level at roughly 430% above current prices. Meanwhile, $0.0100 has become an important psychological level on the latest chart. The immediate resistance area sits around $0.0110 to $0.0116.
A sustained move below $0.0100 could expose $0.0090 to $0.0080. That range matches the earlier trading area before the September 21 breakout.