PENGU’s weekly TD Sequential, Parabolic SAR and Supertrend indicators have all turned bullish, signaling renewed buying potential. Ali Charts identifies $0.025 as the channel midpoint and $0.
- PENGU’s weekly TD Sequential, Parabolic SAR and Supertrend indicators have all turned bullish, signaling renewed buying potential.
- Ali Charts identifies $0.025 as the channel midpoint and $0.045 as a potential target, representing about 430% upside.
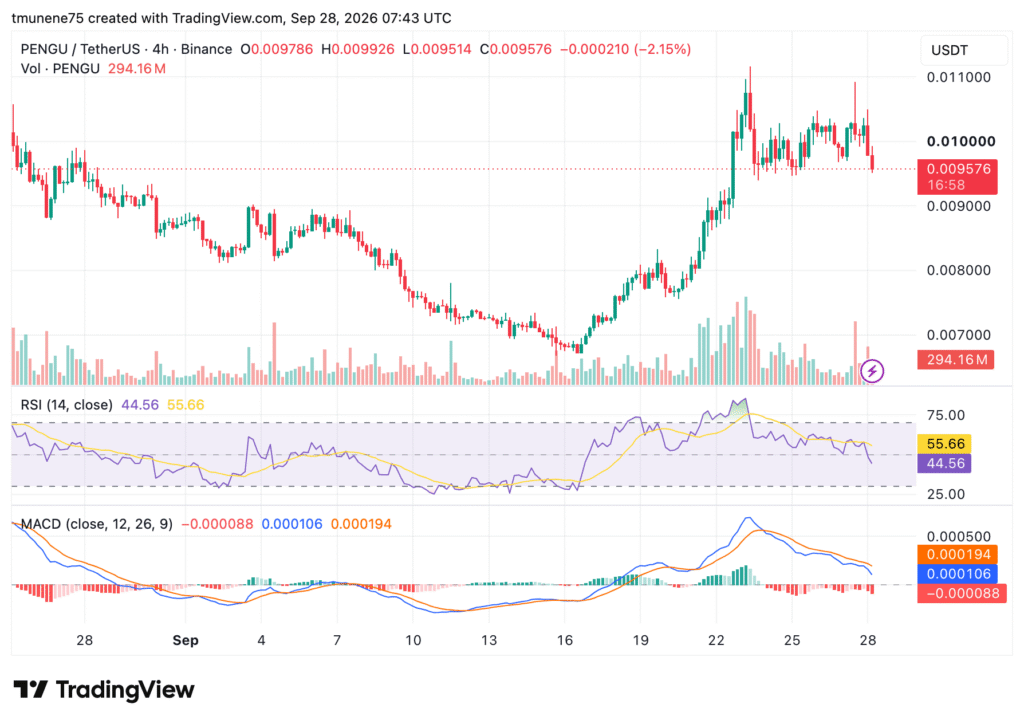
- PENGU trades near $0.0096 with weakening RSI and MACD momentum, while 0.0100-0.0103 remains key resistance.
PENGU has flashed three major weekly buy signals, with analyst Ali Charts identifying $0.045 as a potential price target. The signals involve the Tom DeMark Sequential, Parabolic SAR and Supertrend indicators, which have turned bullish. However, PENGU trades at $0.009576, as weakening momentum and nearby resistance levels shape its current price movement.
Ali Charts Identifies Three Bullish Signals
According to Ali Charts, the Tom DeMark Sequential indicator has produced two consecutive weekly buy signals. The first was a nine setup, followed by a Combo 13, potentially initiating a new bullish countdown.
Meanwhile, the Parabolic SAR has flipped bullish, with its dots moving below PENGU's price. The indicator tracks potential trend direction and may provide dynamic support during upward movements.
The Supertrend indicator has also generated a buy signal. Ali Charts noted that a similar weekly signal previously preceded a 1,156% rally in PENGU. The analyst identified a parallel channel containing PENGU's price action.
Its midpoint near $0.025 represents the first target, while the upper boundary near $0.045 marks another potential level. Ali Charts estimates that reaching $0.045 would represent approximately 430% upside from current levels.
PENGU Consolidates After September Recovery
PENGU recently traded at $0.009576, down 2.15% on the latest candle, with trading volume reaching 294.16 million tokens. The token declined from late August through mid-September, hitting a low near $0.0068 on September 16.
Source:
TradingView
However, PENGU subsequently recovered, climbing toward $0.0108 on September 23. The price has since consolidated, with immediate resistance between $0.0100 and $0.0103.
A move above $0.0103 could bring the recent peak near $0.0108 into focus. On the downside, $0.0090 provides immediate support, followed by $0.0080 and the September low near $0.0068.
RSI and MACD Show Weakening Momentum
PENGU's Relative Strength Index is at 44.56, below its moving average of 55.66. The reading indicates weakening bullish momentum, although RSI remains above the oversold threshold of 30.
Additionally, the MACD histogram reads -0.000088, with the MACD line at 0.000106 and the signal line at 0.000194. The bearish crossover reflects fading upward momentum as PENGU trades below immediate resistance.