PENGU has rebounded twice near the $0.0067–$0.0070 area, raising the possibility of a base after months of downward pressure. PENGU recovered better from overnight losses and came out with be
- PENGU has rebounded twice near the $0.0067–$0.0070 area, raising the possibility of a base after months of downward pressure.
- PENGU recovered better from overnight losses and came out with better daily performance in the latest session as compared to FARTCOIN.
- A sustained move above nearby resistance could strengthen the reversal case, while renewed selling below support would weaken the current setup.
PENGU is showing signs of a possible reversal after months of selling, with repeated support rebounds and stronger short-term performance.
Repeated Rebounds Put Support in Focus
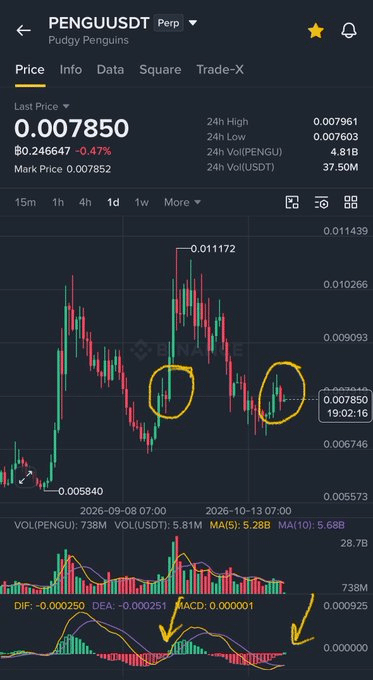
Pure8 described the PENGU daily chart as interesting, drawing attention to a possible change in price structure. The chart shows a decline from approximately $0.011172, followed by a low near $0.005840. Since then, buyers have pushed the token higher, although the earlier downtrend remains relevant.
Source:
X
Two rounded recoveries stand out around the $0.0067–$0.0070 region. Each followed a retreat, with price subsequently climbing away from the lower range. Their resemblance suggests sellers may be losing some control, but two rebounds alone cannot establish a lasting floor.
The latest market data places PENGU near $0.007850, below its previous high. This leaves a considerable distance between the current price and the earlier peak. Buyers must produce further gains before the chart can show a convincing break from its declining structure.
The support region remains important if selling returns. However, a move below around $0.006746 would break the repeated re-bounce pattern, and the more significant low of $0.005840 is lower. If these areas were kept above, the recovery could be given more space to grow.
Resistance and Momentum Will Determine the Next Move
The chart also brings up the possibility of an inverse head and shoulders. Typically three troughs, the middle being lower than the other two. The supplied chart does not set a break above the neckline to confirm.
The first zone of interest is around $0.0078 – $0.0080. The 24-hour high is $0.007961, which brings the token closer to the nearby resistance level. If it continues to move upwards from this range, it will be more convincing that buyers are able to prolong the recovery.
The MACD panel indicates that momentum lines have reached the lower end of their range and are turning up. In addition, the histogram seems to be trending upward from a series of below-average readings. The image, however, does not validate a completed Bullish Cross, so it is not an ending evidence, but rather supporting evidence.
If PENGU hits resistance again, trading will become an issue. The price spike alone is not as strong a sign of a breakout as a breakout with increased volume. On the other hand, if the token rejects close to $0.0080, the token may stall out before another support test.
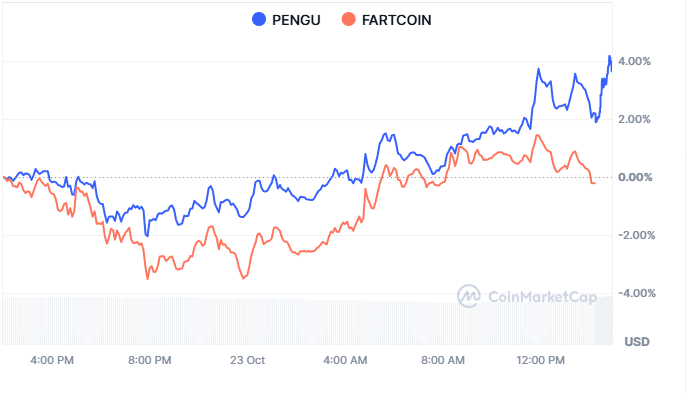
The comparison chart tracks PENGU in blue and FARTCOIN in orange across the same 24-hour period. Both assets decline during the evening, but FARTCOIN falls further, reaching below negative 3%. PENGU’s lowest reading stays closer to negative 2%, showing relative resilience during the sell-off.
Source:
Coinmarketcap
Their paths begin separating more clearly during the overnight recovery. PENGU climbs into positive territory and advances through the morning, while FARTCOIN recovers more unevenly. The gap widens as the blue line rises, indicating stronger percentage performance from PENGU during this period.
PENGU briefly approaches a 4% gain before surrendering part of its advance. It finishes the displayed comparison near a 2% gain, while FARTCOIN falls back toward zero. This difference shows that PENGU retained more of its rebound despite the late pullback.
The accompanying market panel lists PENGU’s market capitalization at approximately $502.29 million. Its 24-hour trading volume stands near $95.15 million as of writing, down 2.44%. The price gain alongside lower volume means the advance did not coincide with rising turnover.
For now, PENGU has a possible reversal structure and stronger short-term performance than FARTCOIN. The next evidence must come from a sustained move above resistance, supported by continued buying. Failure near $0.0080 or a break below recent support would leave the recovery uncertain.