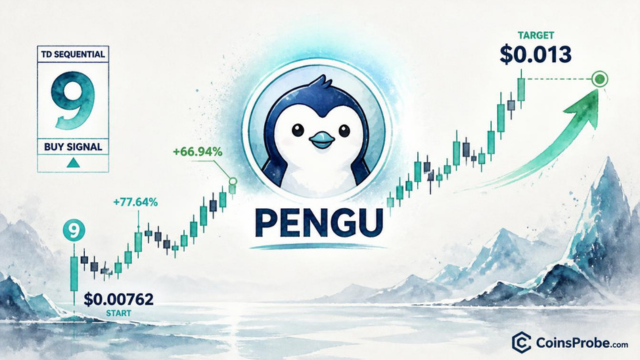
Key Highlights PENGU is trading at $0.00762 after @alicharts flags a new daily TD Sequential buy signal Prior TD Sequential signals produced +77.64% (Aug 7), +66.94% (Sep 15), and −31.58% (Se
Key Highlights
PENGU is trading at $0.00762 after @alicharts flags a new daily TD Sequential buy signal
Prior TD Sequential signals produced +77.64% (Aug 7), +66.94% (Sep 15), and −31.58% (Sep 25) — three-for-three accuracy
Analog upside target near $0.013 if current signal matches prior buy signal magnitude of ~70%
SoFi listing (15M+ users) adds a fundamental catalyst alongside the technical buy trigger
Pudgy Penguins’ token PENGU is flashing a setup that has been three-for-three in calling major trend shifts this cycle. A new TD Sequential buy signal has printed on the daily chart — the same indicator that called the last two rallies of +77.64% and +66.94%, as well as the 31.58% correction that followed them. At the time of writing, PENGU is trading at approximately $0.00762.
The signal was flagged by crypto analyst Ali Martinez (@alicharts), who identifies this as a new daily buy trigger for PENGU. In his October 19, 2026 post, Martinez states the TD Sequential “has been extremely accurate at anticipating trend shifts” for the token, pointing to a three-signal track record — all hitting their directional call with precision. A prior CoinsProbe analysis covering PENGU’s structure noted that getting bearish on the token at key inflection points has historically been the wrong trade.
The TD Sequential is a momentum exhaustion counter developed by Tom DeMark. It counts nine consecutive daily candles closing lower than the close four bars prior — when that count reaches 9, it signals that selling momentum is mathematically exhausted, not that a price floor has been set. The key distinction: the indicator identifies when a trend has run its course, not precisely where price will go next. On PENGU’s daily chart, three separate TD Sequential signals are visually annotated — two buy 9-counts and one sell 9-count — each followed by a labeled percentage outcome. A fourth signal, a new buy 9-count, has now printed near the $0.00762 level.

PENGU Daily Chart Analysis | Source: @alicharts (X)
Martinez documents three prior signals and their outcomes in sequence:
Date
Signal Type
Move Produced
August 7, 2026
Buy (9-count)
+77.64%
September 15, 2026
Buy (9-count)
+66.94%
September 25, 2026
Sell (9-count)
−31.58%
~October 19, 2026
Buy (9-count)
Pending
TD Sequential signal log for PENGU | Source: @alicharts (X)
All three prior signals produced directionally correct outcomes. The two buy signals produced average upside of approximately 72% each. The sell signal caught a 31.58% drawdown. That combination — large asymmetric upside on buy signals and accurate sell-side timing — is what makes the current fourth signal analytically significant rather than coincidental.
It is worth being precise here: the +77.64% and +66.94% figures are historical moves already printed on the chart, labeled between prior price points. They are a completed record, not a projection for the current signal. Martinez’s research note references a potential ~70% rally scenario from the new signal, which would imply a target near $0.013 — but that figure is a rough analog to prior moves, not an explicitly stated price target on the chart itself.
Beyond the TD Sequential count, Martinez notes that PENGU has maintained a structure of higher highs and higher lows through this cycle. That broader structural integrity matters: a TD Sequential buy signal firing inside a broken, lower-low structure carries less weight than one firing inside a functioning uptrend. The fact that the macro structure remains intact — despite the 31.58% pullback triggered by the September 25 sell signal — suggests the correction was a normal cycle within an ongoing bullish sequence, not a trend reversal.
Martinez also flags a fundamental catalyst alongside the technical signal: PENGU’s listing on SoFi, a platform with over 15 million users. The overlap between a technical exhaustion signal and a distribution event that expands the token’s accessible user base is a meaningful combination. New exchange listings historically expand liquidity and introduce fresh demand — when they coincide with a technical buy signal, the catalysts are compounding rather than competing.
Bullish Scenario
If PENGU holds the $0.00762 zone and the current TD Sequential buy signal produces a move consistent with prior buy signals, the analog range is +67% to +78%, pointing toward approximately $0.0127–$0.0135. Martinez’s research note references approximately $0.013 as the rough analog target. Confirmation requires price advancing above the most recent swing high and maintaining the higher-high structure.
Bearish Scenario
TD Sequential buy signals can fail — the indicator identifies exhaustion, not guaranteed reversal. A failure would look like continued lower closes through the current zone without a bounce, particularly a daily close beneath the August structure. If the higher-low structure breaks, the three-for-three track record becomes historically informative but no longer structurally applicable to the trade setup Martinez has outlined.
The TD Sequential has been three-for-three on PENGU across signals dated August 7, September 15, and September 25 — producing +77.64%, +66.94%, and −31.58% directional moves in sequence. A fourth daily buy signal has now printed at approximately $0.00762. Whether that becomes four-for-four will be determined by whether price holds this exhaustion zone and resumes the higher-high structure Martinez documents as still intact. The level to watch on the upside is $0.013 — the analog target if the current signal produces a move comparable to the two prior buy signals.
Disclaimer: The views and analysis presented in this article are for informational purposes only and reflect the author’s perspective, not financial advice. Technical patterns and indicators discussed are subject to market volatility and may or may not yield anticipated results. Investors are advised to exercise caution, conduct independent research, and make decisions aligned with their individual risk tolerance.
Also Read: Only 4.4% of BTC’s 6–12 Month Holders Are Selling — What It Means