PEPE Daily chart has continued to form bullish structure breaks, however, 0.0000037 - 0.00000039 demand zone is still vital. Price fell to $0.000004913 in the latest snapshot, while 24-hour v
- PEPE Daily chart has continued to form bullish structure breaks, however, 0.0000037 - 0.00000039 demand zone is still vital.
- Price fell to $0.000004913 in the latest snapshot, while 24-hour volume declined 53.68% amid weaker intraday momentum.
- Wallets connected to Justin Sun reportedly contain 11.85 trillion PEPE, which are likely to be internal transfers since there are no withdrawals on Poloniex.
PEPE price action is getting conflicting signals with its daily chart structure being bullish, while recent trading weakness is testing nearby bull mark support.
Daily Structure Retains a Bullish Bias
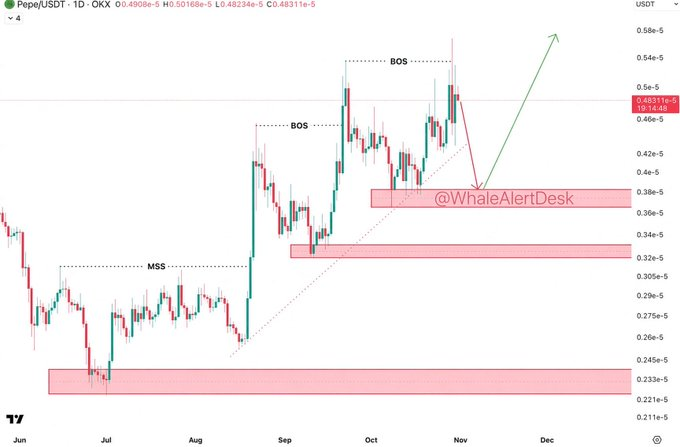
Whale Alert Desk recently identified multiple bullish breaks of structure on PEPE's daily chart. The post pointed to successive higher highs and a developing demand-zone retest. It described the current pullback as a possible pause before another advance.
Source:
X
The chart shows a market structure shift during August. PEPE subsequently broke resistance around $0.0000032, establishing its first marked bullish break. Further advances carried the token towards approximately $0.0000050.
Another upward move produced a higher high near $0.0000055. This followed earlier breaks of structure during the September recovery. The sequence suggests buyers controlled several important swings after August's reversal.
However, the advance later entered consolidation between approximately $0.0000038 and $0.0000046. Price eventually recovered towards $0.0000055 before encountering renewed selling. The resulting decline has brought the upper demand zone back into focus.
Demand Support Meets Weaker Short-Term Momentum
The marked demand area sits between approximately $0.0000037 and $0.0000039. This region previously attracted buyers during September's consolidation. A successful defence could help PEPE establish another higher low.
The chart also identifies lower support around 0.0000032–0.0000033. This area represents another historical buying zone from the recovery. A breakdown through upper demand could expose this lower region.

The CoinMarketCap data showed PEPE trading at $0.000004913 at the time of writing. Its 24-hour performance stood at negative 2.73%. The intraday chart showed repeated failed recoveries around 0.00000500–0.00000505.
Selling accelerated during the latter part of the displayed session. Price approached $0.00000490 after forming several lower short-term highs. Meanwhile, reported trading volume declined 53.68% to approximately $461 million.
Whale Holdings Add Another Market Variable
Separate attention has focused on reported holdings linked to Justin Sun. Yagacalls Elite cited Arkham Intelligence data showing nearly 11.85 trillion PEPE. The reported balance carries an estimated value of approximately $51.25 million.
That position represents roughly 2.82% of PEPE's total supply. Two large Poloniex withdrawals occurred on October 17 and October 26. Their timing prompted speculation about possible accumulation.
However, the withdrawals do not establish that new purchases occurred. Poloniex has a connection to Sun, making internal transfers another possible explanation. Wallet movements alone cannot confirm the purpose behind those transactions.
If the holdings remain concentrated, their scale could attract continued market attention. Yet ownership does not reveal whether the wallets intend to buy, hold, or sell. Confirmation of fresh accumulation would require clearer transaction evidence.
For the technical setup, the upper demand zone remains the immediate reference.Rebound may help push this up toward $0.00000500 and prior highs. On the other hand, a prolonged move below demand may bring in lower support at $0.0000032. The reported whale balance adds interest, but does not confirm a bullish reversal.