Veteran trader Peter Brandt is watching an unusual setup in the gold/silver ratio that could point to much stronger relative performance from gold. “Looks to me as if Gold/Silver might take a
Veteran trader Peter Brandt is watching an unusual setup in the gold/silver ratio that could point to much stronger relative performance from gold.
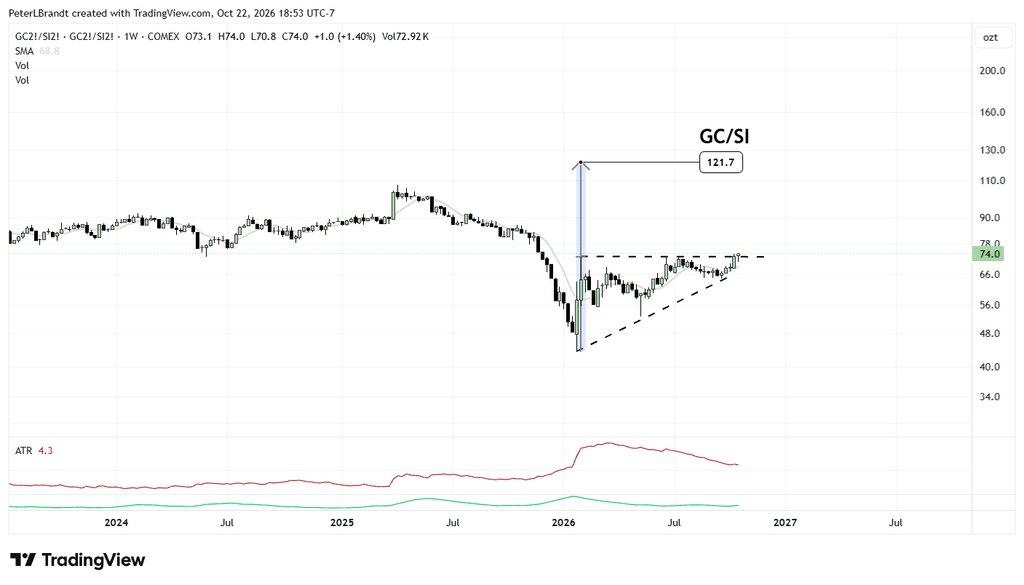
“Looks to me as if Gold/Silver might take a run at an ATH,” Brandt wrote, sharing a weekly TradingView chart of the GC/SI ratio.
Brandt is not predicting that both gold and silver will necessarily hit new all-time highs. His chart is focused on the ratio between the two metals.
In simple terms, a rising gold/silver ratio means gold is outperforming silver. That can happen because gold rises faster, silver falls faster, or both happen at the same time.
The ratio is currently around 74, and Brandt’s chart maps a much larger move toward approximately 121.7.
Brandt’s Chart Shows Gold Gaining Relative Strength
The weekly chart shows the gold/silver ratio falling from above 100 in 2025 to below 50 during the extreme move earlier in 2026.
Since then, the structure has changed.
The ratio has been making higher lows, creating a rising support line beneath price.
At the same time, it has repeatedly struggled around the 73-75 area.
 Source: X/@PeterLBrandt
Those two boundaries form an ascending triangle.
The ratio is now back near 74 and once again testing that horizontal resistance.
That is the key area on Brandt’s chart.
A convincing weekly break above roughly 74-75 would strengthen the case that the months-long consolidation is resolving higher.
Brandt marks a potential upside objective near 121.7.
From the current ratio near 74, that would represent roughly 64% upside.
Again, that is not a gold price target.
It means the value of gold relative to silver could increase dramatically.
The chart also shows the ratio trading above its weekly moving average near 68.8, adding to the improving relative trend.
What This Could Mean for Gold Price
Brandt’s call can be interpreted as a bullish relative-strength view on gold.
If the gold/silver ratio eventually reaches 121.7, gold would need to outperform silver by a substantial margin from current levels.
There are several ways that could happen.
Gold could rally strongly and silver rise much less.
Gold could remain relatively stable as silver falls.
Or both metals could decline, with silver falling much faster.
That is why the ratio alone does not tell us the exact future dollar price of gold.
But given the current macro environment, the setup is still relevant for gold investors because it indicates Brandt expects gold to become significantly stronger relative to silver.
The first confirmation is straightforward.
The ratio needs to break and hold above roughly 74-75.
If that happens, the next larger move could begin.
If the ratio is rejected again, the rising support line in the upper-60s becomes important.
For me, the most interesting part of Brandt’s chart is not the 121.7 target itself.
It is the fact that the gold/silver ratio has spent months building higher lows beneath the same resistance area.
That type of compression creates a clear decision point.
If the ratio breaks higher, Brandt’s gold price outlook becomes effectively more bullish relative to silver, even without him giving a specific dollar target for XAU.
Overall, Brandt is not calling for gold and silver to reach record highs together.
He is saying gold could dramatically outperform silver, with the ratio potentially making a run toward a new all-time high.
Gold Price Prediction: What Could XAU Do Next?
Brandt’s chart is about the gold/silver ratio, so it does not give us a direct XAU/USD target. For gold itself, the more useful levels are around the current $4,000 area.
If gold can stabilize above $4,000 and reclaim roughly $4,075-$4,100, I would then watch $4,150-$4,200 as the next recovery zone.
A stronger move above $4,200 would improve the structure significantly and could reopen the path toward $4,300 and higher.
The bearish scenario is straightforward. If $4,000 fails decisively, gold could extend the correction toward approximately $3,950, followed by the $3,900 area.
For now, my base case would be for gold to trade between roughly $3,950 and $4,200 until the market gets a clearer signal from oil, Treasury yields and the Federal Reserve.
For more financial news and price predictions, click here.
Subscribe to our YouTube channel for daily crypto updates, market insights, and expert analysis.
The post Peter Brandt’s Gold Price Prediction: This Chart Could Signal Another Record-High Run appeared first on CaptainAltcoin.