What to Know PHA trades near $0.078179 after retreating from $0.090567, although its price remains above the upper Bollinger Band at $0.072513. Phala’s AI infrastructure developments coincide
What to Know
- PHA trades near $0.078179 after retreating from $0.090567, although its price remains above the upper Bollinger Band at $0.072513.
- Phala’s AI infrastructure developments coincide with the rally, while futures turnover substantially exceeds spot volume and increases reversal risk.
- Holding $0.0725 could support another challenge of $0.0906, whereas a breakdown may bring $0.055 and $0.044 into view.
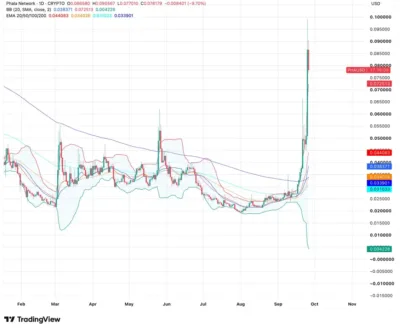
Phala Network (PHA) trades near $0.078179 following a retreat from an intraday high of $0.090567, leaving buyers to defend a breakout that carried the token beyond its upper Bollinger Band at $0.072513. The advance followed months of relatively narrow trading near $0.03, but the pullback shows that sustaining the move may prove harder than reaching a new high.
According to TradingView analysis, PHA remains well above its 20-day exponential moving average (EMA) at $0.044083, its 50-day EMA at $0.034026, its 100-day EMA at $0.031033, and its 200-day EMA at $0.033901. Those levels show how far the token has moved beyond its earlier range and how much ground it could give back while remaining above its longer-term averages.
Also Read: Cronos Price Prediction 2026–2030: Can CRO Hit $0.10 Soon?
Buyers Face a Test Above the Upper Bollinger Band
PHA’s move through the upper Bollinger Band at $0.072513 marked a break from the compressed range that prevailed through much of August and September. Holding around $0.0725 would suggest buyers are defending the breakout, potentially setting up another attempt at the session high near $0.0906.
However, the retreat from $0.090567 indicates that sellers emerged as the price approached $0.09. If buyers clear that level, resistance near $0.098 and the psychological $0.10 mark would become the next areas to watch.
A close below $0.0725 would weaken the immediate breakout structure and could expose support near $0.055. Beyond that, the 20-day EMA around $0.044 offers another reference point, while the Bollinger Band midpoint near $0.038 represents a deeper test of the wider advance.
Technical Outlook
The distance between PHA’s price and its moving averages reflects powerful short-term momentum, although it also leaves the token exposed to a larger pullback if buying pressure fades. Bollinger Bands expanded considerably as the rally accelerated, signaling greater volatility rather than guaranteeing that the upward move will persist.
Derivatives activity adds to that uncertainty, with CoinGlass figures putting 24-hour futures turnover at $1.94 billion against $76.04 million in tracked spot trading, while open interest stood at $42.69 million. Turnover measures trading activity rather than the amount of money committed to long-term positions, but the gap suggests leveraged traders played a substantial role in the move.
Source: Tradingview
Can Phala Network Reach $0.10?
PHA would need to gain approximately 28% from $0.078179 to reach $0.10, making the target possible within a renewed breakout but dependent on buyers first clearing $0.0906 and $0.098. A move above those levels would be more convincing if spot demand strengthened alongside the price, particularly given the unusually heavy futures turnover.
Phala’s confidential computing products provide a real business backdrop to the trading activity, and the reported SayGM AI-inference launch coincided with the rally. Still, no single development has been confirmed as its primary cause, while a pending governance proposal and circulating valuation claims should not be treated as established drivers.
Phala also disclosed a June 2026 cloud API vulnerability that allowed unauthorized changes to some customer workloads; the company reported patching the affected endpoint on June 1. The incident remains relevant when assessing the longer-term adoption prospects of its confidential computing services. Phala
Phala Network Price Prediction (2026–2030)
Year
Bearish scenario
Middle scenario
Bullish scenario
2026
$0.038
$0.075
$0.12
2027
$0.030
$0.090
$0.16
2028
$0.025
$0.11
$0.22
2029
$0.020
$0.14
$0.30
2030
$0.015
$0.18
$0.40
Price Forecast by Year
2026
PHA could challenge $0.10 and extend toward the illustrative $0.12 upper scenario if buyers preserve support at $0.0725 and the rally gains stronger spot participation. Losing $0.055 would instead put the lower end of the range nearer $0.038 into consideration.
2027
A sustained recovery could bring PHA toward $0.16 if Phala expands usage of its confidential AI infrastructure and token demand keeps pace. Conversely, weaker adoption or a broader crypto market decline could leave the price closer to $0.030.
2028
The illustrative bullish scenario reaches $0.22, although such an advance would require more than a brief speculative surge. Consistent usage growth, improved liquidity, and evidence that Phala’s products contribute to PHA demand would strengthen the case for higher prices.
2029
PHA could approach $0.30 under favorable market and adoption conditions, while disappointing growth would make a much lower outcome possible. The wide range reflects how little today’s breakout alone can establish about the token’s value several years from now.
2030
The upper scenario places PHA near $0.40, with $0.18 representing a more moderate illustration of sustained demand. Neither figure should be read as a likely outcome without clearer evidence of future revenue, token utility, and durable market participation.
Conclusion
PHA remains above the upper Bollinger Band near $0.0725 despite pulling back from $0.090567, leaving the breakout intact while showing that sellers are active at higher prices. A renewed move through $0.0906 could bring $0.098 and $0.10 into view, whereas losing $0.0725 would raise the risk of a retreat toward $0.055.
Phala has established confidential computing products, but the scale of futures trading relative to spot volume makes the immediate price move vulnerable to changes in leveraged positioning. The longer-term outlook depends on whether product usage and token demand develop beyond the current burst of trading activity.
FAQs
1. Is PHA currently bullish? PHA remains above its upper Bollinger Band and all four cited EMAs, although the retreat from $0.090567 shows that buyers face resistance at higher levels.
2. What is PHA’s most important nearby support? The upper Bollinger Band near $0.0725 is the immediate level to watch, followed by $0.055 and the 20-day EMA near $0.044.
3. What are PHA’s major resistance levels? The recent high near $0.0906 comes first, followed by $0.098 and $0.10.
4. Can PHA reach $0.10? PHA could reach $0.10 if it holds the breakout and clears the intervening resistance levels, but heavy derivatives activity increases the risk of a reversal.
Also Read: Bedrock Price Prediction 2026–2030: Can BR Hit $2 Soon?
The post Phala Network Price Prediction 2026–2030: Can PHA Hit $0.10 Soon? appeared first on 36Crypto.