Phala price prediction searches jumped this week as $PHA turned into one of the fastest-moving tokens in the market. The rally pushed the coin from a few cents into a real breakout zone withi
Phala price prediction searches jumped this week as $PHA turned into one of the fastest-moving tokens in the market. The rally pushed the coin from a few cents into a real breakout zone within days.
Traders scanning thecrypto price prediction hub noticed PHA trending alongside AI-linked tokens well before the spike peaked. Something shifted fast here. As of September 26, 2026, near 07:01 UTC, PHA traded around $0.0779.
PHA Price Prediction Quick Snapshot
PHA trades in a tight band between $0.075 and $0.10, depending on the exchange and timestamp checked. That range is the whole Phala price prediction story right now.
Resistance near $0.10 caps the upside for now. Support sits near $0.075, with a deeper floor around $0.065.
Turns out, it's less about the price tag. More about whether buyers can hold what they've already won.
Current Price and Market Data
As of September 26, 2026, CoinMarketCap data shows PHA at $0.07791, up 37.44% on the day, with a market cap near $66.77 million and 24-hour volume at $238.14 million.
A near-identical snapshot the same day showed $0.07789, up 37.39%, with the 24-hour range running from a low of $0.05546 to a high of $0.09777.
The circulating supply sits at 857 million PHA of a 1 billion total supply. Holders number 37,866 addresses, per on-chain data.
When we pulled up the holder breakdown, the top 100 wallets controlled 92.54% of the market cap, with whale concentration at 89.12%. That's a figure worth watching.
The all-time high remains $1.41, set May 15, 2021, putting current levels 94.44% below that peak. The all-time low of $0.01921 came just weeks ago, on August 03, 2026.
Traders checking active markets often cross-referencecrypto exchange listings before placing new positions.
Why Is Phala Price Rising
The short answer: AI narrative rotation. Capital flowed into confidential computing and AI-infrastructure tokens, and PHA caught that wave hard.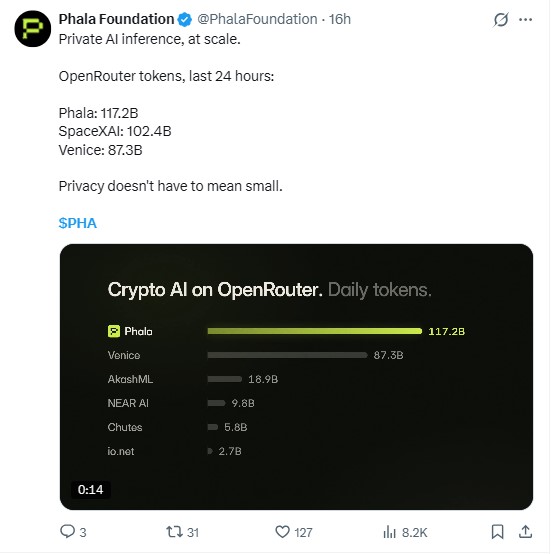
And the numbers back it up. Phala's OpenRouter throughput hit 117.2 billion tokens in 24 hours, ahead of rivals including SpaceXAI and Venice, per arecent update from Phala Foundation.
Readers following theAI crypto news section will recognize this rotation pattern from other compute tokens.
But rotation cuts both ways. Sentiment moved before fundamentals fully caught up, and that's usually when volatility spikes.
Technical Analysis: Trend, RSI, and MACD
The daily PHA/USDT trading pair on MEXC opened at 0.08643, ran up to a high of 0.09069, dipped to a low of 0.07677, and was last trading near 0.07794, down 10.06% on the day at 16:59 UTC. That is a clean break out of a multi-month descending channel.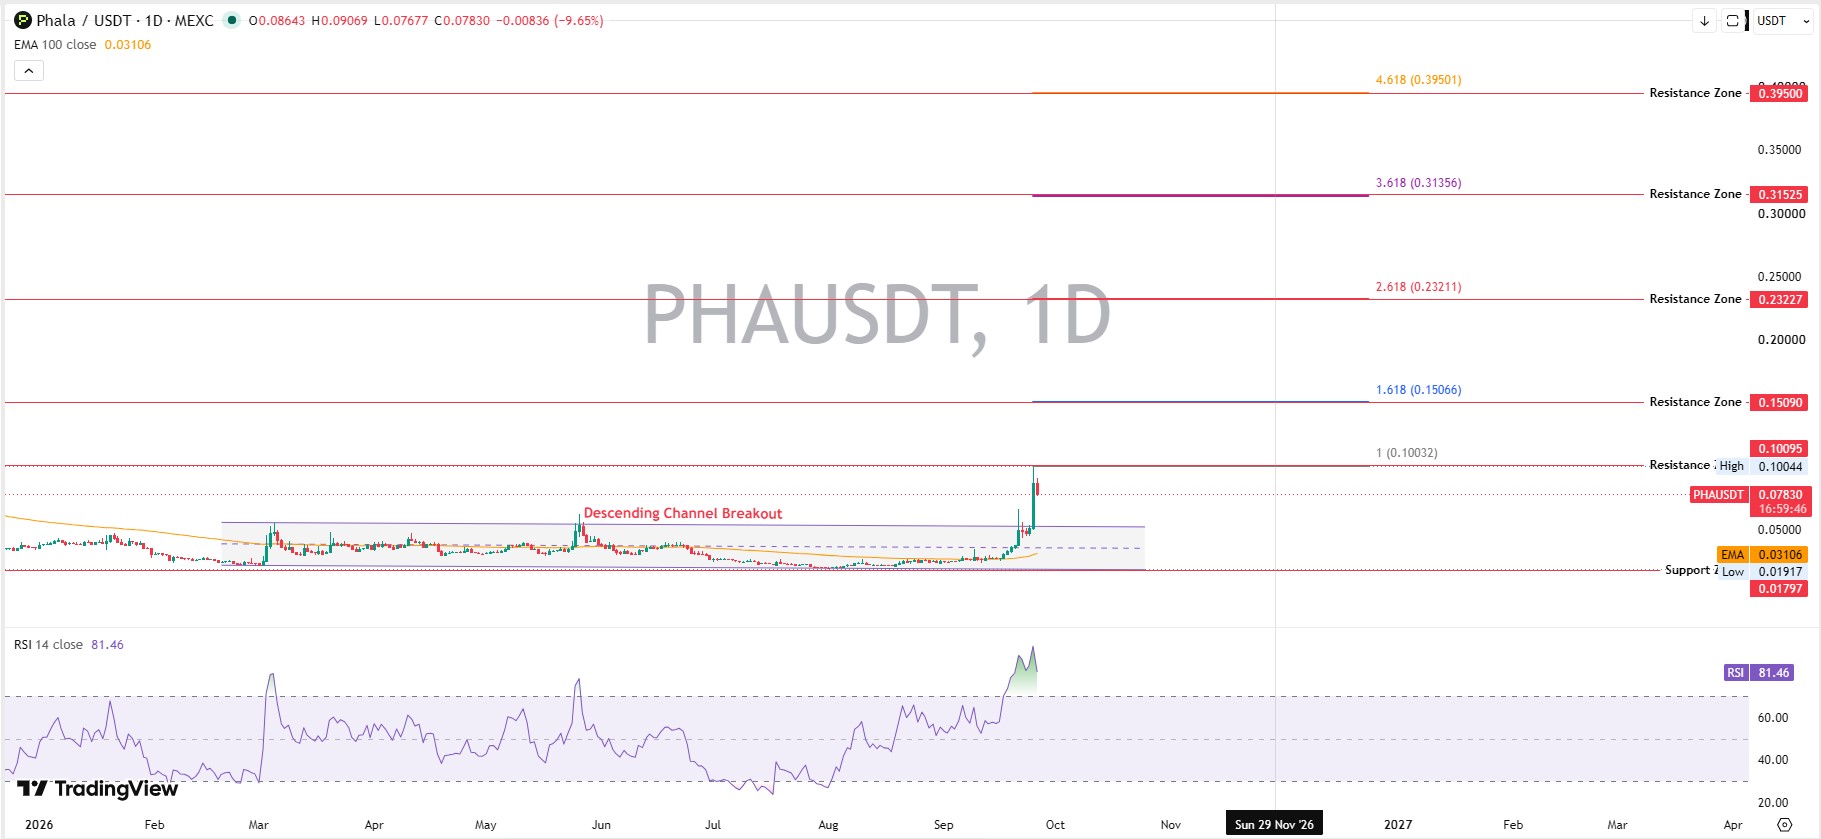
When we checked the trading pair directly, the descending channel breakout stood out immediately against months of sideways drift.
The 100-period EMA sits at 0.03106, far below current trading levels. That gap alone shows how sharply this move separated from the longer-term trend.
RSI (14-period) reads 81.46 on the daily timeframe, firmly inside overbought territory above 70.
PHA looks strong here; well, strong is relative when RSI sits this far above 80.
MACD (12, 26, 9) stays positive at 0.01111, above its signal line of 0.00607, with the histogram at 0.00504 and cooling from its peak.
Momentum indicators this stretched rarely hold in a straight line. Is a pullback coming before the next leg higher?
Support and Resistance Levels
Four Fibonacci extension zones sit above current levels on the chart: $0.10044 to $0.10095, then $0.15090, then $0.23227, then $0.31525, and finally $0.39500 near the top of the range.
Resistance in the $0.10044 to $0.10095 band is the immediate wall. Clearing it on strong trading volume opens the door toward the next zone near $0.151.
Support near $0.075 to $0.078 marks the recent breakout base, the level PHA cleared during the descending channel breakout. The chart's deeper structural floor sits far lower, in the $0.01797 to $0.01917 zone, which lines up closely with the token's all-time low.
Three floors matter here depending on the time frame. Short-term traders watch $0.075. Long-term charts watch the base near $0.018.
Volume and Breakout Analysis
Volume told the real story. Spot volume alone hit $77.37 million in 24 hours, while futures volume ran far higher at $1.99 billion, per CoinGlass tracking.
Price up 39.97% on the day. Volume up sharply too. That combination usually signals real participation.
But liquidations followed fast.CoinGlass data showed $5.06 million in 24-hour liquidations, split between $1.84 million in longs and $3.22 million in shorts. The 12-hour window alone wiped out $3.08 million.
Traders got overextended.
Fundamentals and AI Narrative
Phala positions itself around confidential computing, using trusted execution environments, or TEE, infrastructure built for AI workloads.
Venice AI now runs its private TEE models on Phala's network, with every run hardware-verified. Phala's own dashboard logged 202.74 billion. Confidential AI tokens processed in a single 24-hour window earlier this week.
Turns out, usage growing doesn't automatically mean token demand grows at the same pace.
Tokenomics and On-Chain Data
Roughly 857 million of the 1 billion PHA supply is circulating, leaving fairly limited unlock pressure ahead.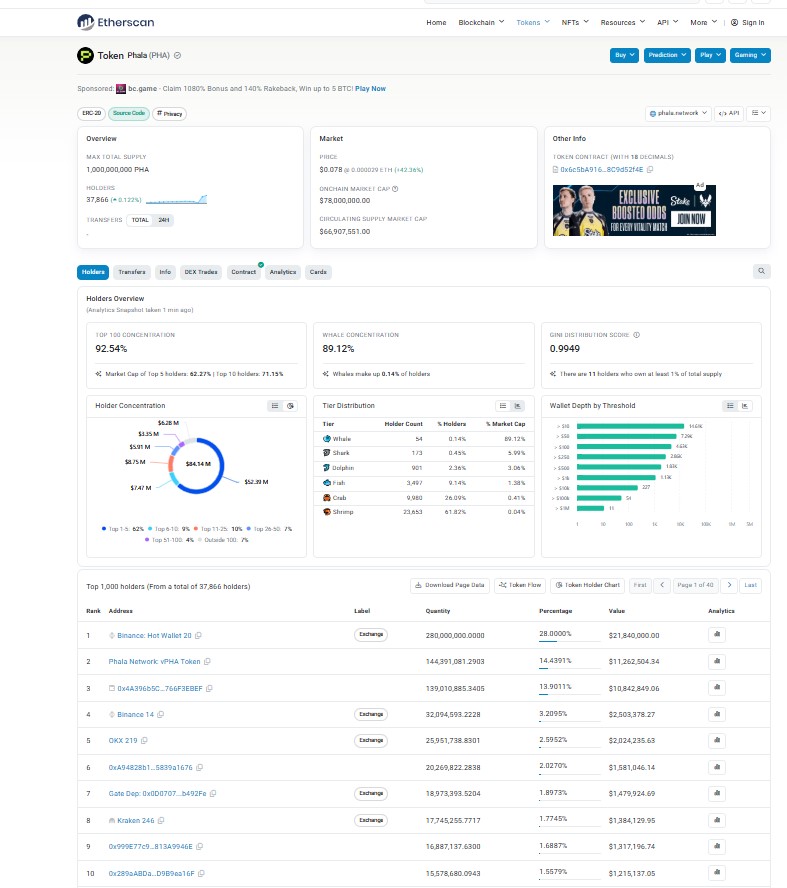
Whale concentration on-chain sits near 89.12%, per the network's holder data on Etherscan. That's a figure worth sitting with.
And no fresh unlock event is confirmed for now. Fine.
Ecosystem growth like this often triggers fresh reward programs too, something worth tracking on thecrypto airdrops page.
Competitor Token Analysis
Structural peers in the AI-compute category include Akash Network, Render, Aethir, and Oasis. These aren't identical projects, so any comparison should focus on category, not equivalence.
Metric
PHA
AKT
RENDER
ATH
ROSE
Market cap
~$66.7M
~$204M
~$1.0B
~$124M
~$67M
24h volume
~$238M
~$10M
~$71M
~$13M
~$5M
Supply
1B
388.5M max
644.2M max
42B
10B
Core focus
Confidential AI
Decentralized cloud
GPU rendering
GPU cloud
Confidential compute
When we compared PHA against these peers, the confidentiality angle stood out as its sharpest edge. AI relevance runs high across the whole group.
Recent Catalysts
Confidential AI integrations. GPU TEE support. A joint paper with OPPO on Kubernetes Pod-level remote attestation, published back in June.
These aren't rumors. They're documented moves, the kind tracked on acrypto events calendar.
Here's the thing: none of this is brand new. The market just noticed it all at once.
Broader Market Context
Bitcoin trades at $84,007.84, up just 0.1% on the day, with a market cap near $1.68 trillion. That calm gives room for altcoin moves like this one.
PHA behaves like a high-beta altcoin. If Bitcoin stays quiet, momentum breathes.
And if Bitcoin drops hard, PHA likely gets hit harder than most. Its next move depends on Bitcoin as much as its own trading pattern.
Broader AI sentiment also spilled into unrelated corners of the market, a trend covered incrypto news updates.
Price Prediction Scenarios
Bull case:a confirmed trading session above $0.10 on strong volume could open $0.11 to $0.13 over coming weeks.
Base case:PHA consolidates between $0.065 and $0.10 while momentum cools off. Traders comparing early-stage AI setups sometimes browsepresale and IDO listings for similar plays.
Bear case: losing $0.075, then $0.065, sends the token back toward the $0.05 to $0.065 zone, the earlier breakout base.
Invalidation Levels and Risks
A sustained trading session below $0.075 weakens the short-term bullish case. Below $0.065, the broader bullish structure fails outright.
On the flip side, a strong push above $0.10 on real volume weakens the bearish thesis fast.
RSI near 81 with a move this fast rarely ends smoothly. Exactly.
Disclaimer
This article serves informational purposes only and doesn't constitute financial, investment, or trading advice. Cryptocurrency markets, including PHA, stay highly volatile, and the price levels discussed here are analytical zones based on data available at the time of research, not guaranteed outcomes. Anyone weighing a trading decision should conduct independent research and consult a qualified financial advisor before acting.
