PI Network is up roughly 9.7%-28%over past seven days PI's weekly chart just printed something it hasn't shown since before the July collapse: a bullish candle, where this week's full range s
PI Network is up roughly 9.7%-28%over past seven days
PI's weekly chart just printed something it hasn't shown since before the July collapse: a bullish candle, where this week's full range swallowed last week's decline entirely. That's not a minor technical footnote.
On a weekly timeframe, a like this typically signals more than a one day bounce, it suggests a shift in who's actually in control of the chart.
PI is up roughly 9.7%-28% over the past seven days, trading near $0.092–$0.096 after climbing from the July 14 all-time low of $0.070979.
This piece treats that weekly signal seriously while keeping the claim honest about how far it can realistically carry price.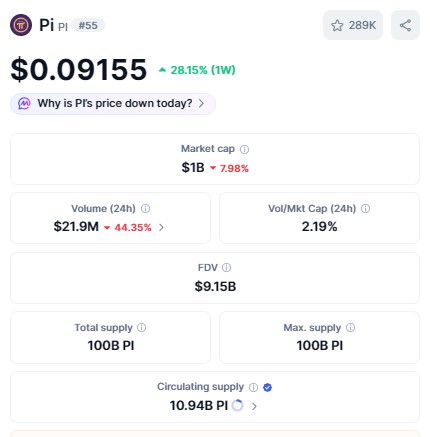
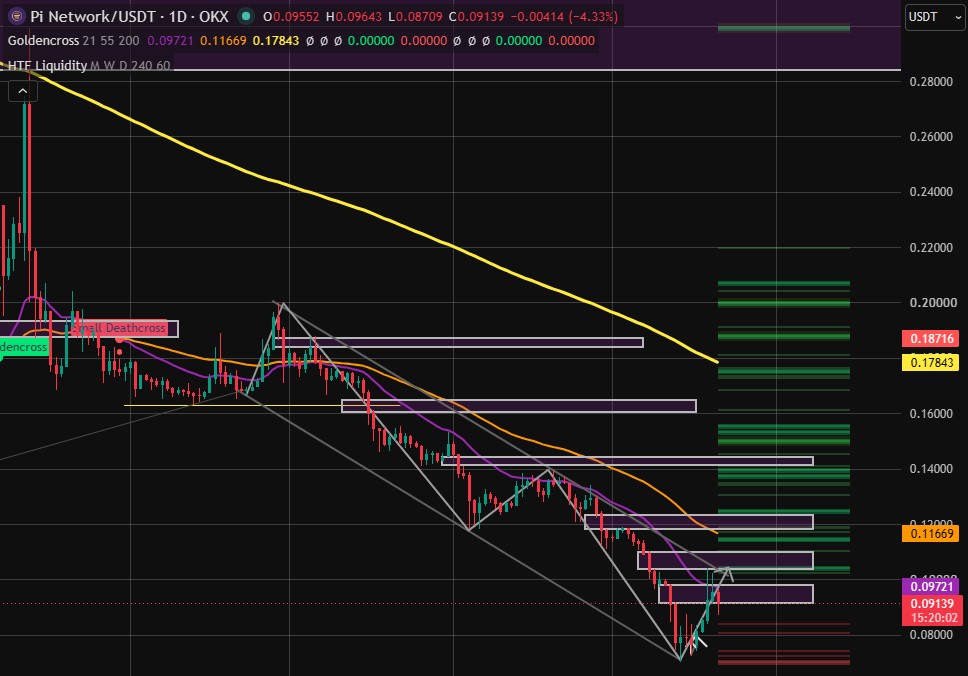
PI trades near $0.092–$0.096 today, up about 9.7%- 28% over the past 7 days, having reclaimed its 20-day EMA near $0.097 for the first time since the decline began.
The weekly chart shows a bullish pattern, a formation where an entire week's gain erases the prior week's loss, which technical analysts read as a meaningful shift in short-term control from sellers to buyers.
The next real tests sit at the 50 day EMA ($0.115–$0.122) and, further out, the 100 day EMA ($0.135–$0.140).
Some coverage has floated a revisit of PI's $3 all-time high on the back of this pattern. That's not a realistic near-term claim, it would require roughly a 30x move from today's price.
Read the engulfing pattern for what it actually signals: room for a meaningful multi-week move within a still-damaged broader trend, not an imminent return to launch-era prices.
The Insider Data: What a Weekly Bullish Engulfing Pattern Actually Signals
Detail
Explanation
Pattern definition
A weekly candle whose full range (open to close) completely engulfs the prior week's candle, in the opposite direction of the prior trend
Why it matters more on weekly charts
Weekly patterns filter out daily noise, capturing a full week of aggregated buying and selling; a reversal signal here carries more statistical weight than the same pattern on a daily chart
PI's specific setup
This week's gain has erased last week's decline, following the July 14 all-time low, the sharpest capitulation point in PI's public trading history
Immediate confirmation already achieved
Reclaiming the 20 day EMA near $0.097, the first of four major moving averages PI needed to clear
Next test
50 day EMA near $0.115–$0.122; a decisive close above this would be a stronger confirmation than the engulfing pattern alone
Historical precedent for PI specifically
A similar bullish engulfing weekly candle in May preceded a run from roughly $0.287 (comparable token pattern) to notably higher levels on elevated volume, though each instance should be judged on its own merits
The reason this pattern deserves attention rather than a quick mention: it's one of the more statistically reliable reversal signals in technical analysis precisely because it requires a full week of sustained buying to form, not a single volatile session.
PI achieving this immediately after its deepest capitulation low is a genuinely different setup than the choppy, single day bounces that characterized the first two weeks of July.
Why 'Won't Be Small' Doesn't Mean 'Will Retest the All-Time High'
It's worth directly addressing the more excitable claims circulating alongside this pattern: some coverage has suggested PI could work back toward its $2.98–$3.00 all-time high by the end of 2026. That would require roughly a 30x move from current levels, a claim disconnected from anything the current technical setup actually supports.
What the engulfing pattern does support is a case for a meaningful, multi-week move toward the 50 day and eventually 100-day EMAs, roughly $0.115 to $0.140, a substantial percentage gain from here without requiring anything close to a full trend reversal back to 2025 levels.
What's Still Working Against This Setup
● The 127.5 million PI July unlock continues adding supply regardless of the technical pattern.
● PI remains below its 200-day EMAs, meaning the broader, longer-term trend has not reversed.
● Extended technical patterns can fail, particularly in thinly traded, retail-heavy markets like PI's.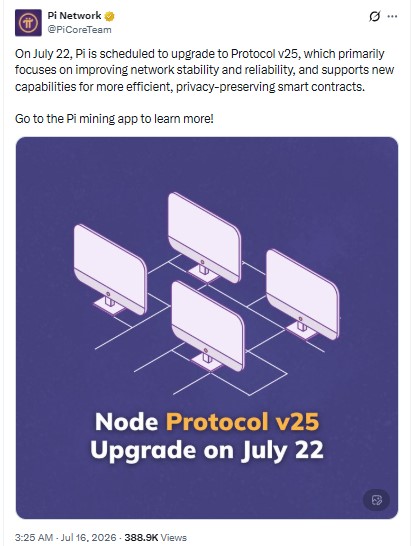
● Protocol v25's July 22 launch, one day from now, adds a binary event risk that could either reinforce or disrupt the current momentum.
Quick Facts: PI Network
Metric
Current Reading
Current Price (approx.)
$0.092–$0.096
7-Day Change
9.7%- 28%
Weekly Chart Pattern
Bullish confirmed
20- EMA
$0.097- recently reclaimed
50- EMA (next test)
$0.115–$0.122
100-EMA
$0.135–$0.140
All-Time Low (July 14)
$0.070979
Protocol v25 Launch
July 22, 2026 (tomorrow)
Pending Unlock
127.5 million PI over 30 days, ongoing
Technical Analysis
Indicator
Current Reading
Signal
Weekly chart pattern
Bullish confirmed
Statistically meaningful reversal signal on a weekly timeframe
Price vs. 20- EMA
Reclaimed, $0.097
First resistance rung cleared
Price vs. 50/100/200-day EMAs
Still below all three
Broader trend remains technically bearish despite the weekly signal
7-day change
+28%
Confirms the pattern with actual price performance, not just candle shape
Protocol v25
Launches tomorrow, July 22
Near-term binary catalyst
Pi Network Price Prediction: Bear, Base, Bull, and Extreme Bull Scenarios
Scenario
Next 30 Days
End of 2026
Key Condition
Bear Case
$0.075–$0.09
$0.06–$0.10
Weekly engulfing pattern fails to follow through; unlock supply overwhelms momentum
Base Case
$0.095–$0.12
$0.10–$0.16
Pattern holds; 50 EMA becomes the next real test following v25's launch
Bull Case
$0.12–$0.15
$0.16–$0.24
50 EMA clears; v25 drives visible adoption; 100-day EMA comes into range
Extreme Bull
$0.16+
$0.25–$0.40
Full EMA ladder clears; sustained volume; broader altcoin sentiment materially improves
Risk & Opportunity
Risks
Opportunities
PI remains below the 50,100and 200-day EMAs, keeping the longer-term trend bearish
The weekly bullish pattern is a statistically meaningful signal that PI hasn't shown since before its July collapse
127.5 million PI unlock supply continues entering circulation regardless of the technical setup
The 20-day EMA has already been reclaimed, the first confirmation step in a longer recovery ladder
Some coverage's ATH-retest framing sets unrealistic expectations that could sour sentiment if unmet
Protocol v25's July 22 launch offers a genuine, near-term substantive catalyst just one day away
Extended technical patterns can fail, especially in thin, retail-heavy markets like PI's
A confirmed move toward the 50-day EMA would represent a substantial, realistic gain without requiring a full trend reversal
YMYL Disclaimer: This article covers cryptocurrency, a Your Money or Your Life (YMYL) subject. It is for informational purposes only and does not constitute financial, investment, or legal advice. Pi Network carries elevated uncertainty given its relatively short trading history, large uncirculated token supply, and unusual distribution model. Prices, technical patterns, and unlock figures referenced here reflect publicly available information as of July 21, 2026, and may change without notice. Always conduct independent research and consult a licensed financial advisor before making investment decisions.