Pi Network has given its holders a rough start to the week. A coin that was quietly climbing through early September suddenly reversed course, wiping out days of gains in a single session. Th
Pi Network has given its holders a rough start to the week. A coin that was quietly climbing through early September suddenly reversed course, wiping out days of gains in a single session.
The question now on every trader's mind is whether this is a temporary shakeout or the beginning of a deeper slide.
Pi Network launched its mainnet in February 2025 after years of running as a mobile mining app that attracted millions of users worldwide.
Since then, the Pi Coin has traded with sharp swings, reflecting both its young market and the ongoing debate around its circulating supply.
The Pi Network price today is $0.0867, down 11.5% over the past 24 hours. The 24-hour range sits between $0.08565 and $0.09803, and the market capitalization stands at $970.68 million.
Live Market Data
Metric
Value
Price
$0.0867
24h Change
-11.5%
Market Cap
$970.68M
Fully Diluted Valuation
$1.493B
24h Trading Volume
$13.15M
Circulating Supply
11.196B
Total Supply
17.224B
Max Supply
100B
Source: $PI market data taken from CoinGecko, as of Sep 16, 2026. Figures may vary slightly across other tracking websites.
Pi Network News Today
The Pi Core Team has begun rolling out the Protocol V27 upgrade, starting with a Testnet 2 implementation, according to BSCN.
The team plans to transition the upgrade to Mainnet before the end of the week. 
Source: Data Taken From @BSCNews, X Account, as of Sep 16, 2026
This update also brings the $PI Node Docker to version 27.1.0, with the broader goal of strengthening network stability.
BSCN noted that the upgrade lays groundwork for future features, including integration with $PI Dex, and frames it as a meaningful step toward decentralizing the network further.
For a project whose supply and centralization structure has drawn scrutiny, this kind of infrastructure update carries weight beyond short-term price action.
Pi Network Technical Analysis
The daily chart on TradingView (OKX feed) shows PI/USDT.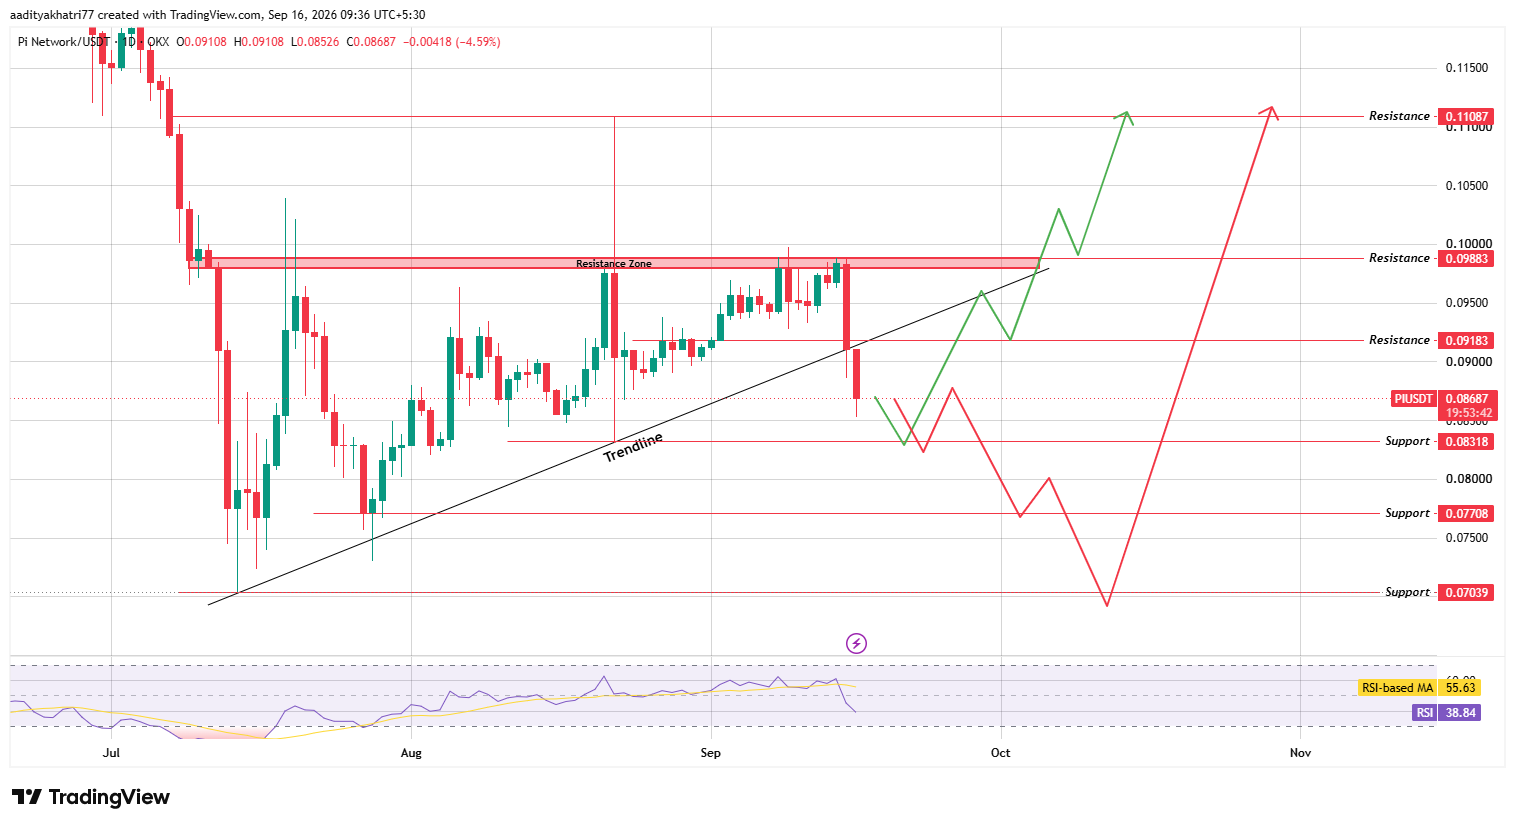
Source: Chart taken from TradingView, as of Sep 16, 2026
Price had been riding above a rising trendline drawn from the July lows, but this candle sliced through that trendline on rising downside pressure.
The Relative Strength Index reads 38.84, below its own moving average of 55.63, signalling that momentum has shifted toward sellers for now.
Can $PI Coin Bounce Back Toward Resistance?
If buyers step back in near current levels, the first test comes at $0.09183.
A daily close above this level on strong volume would open the door toward the $0.09883 resistance zone, an area that has already rejected price twice this month.
Clearing that zone with a confirmed candle close and above-average volume would put the $0.11087 resistance in play, a level $PI has not visited since early July.
What Happens If $PI Breaks Support?
The alternate scenario is less encouraging. A confirmed daily close below $0.08318 would suggest the trendline break is more than a brief dip.
In that case, $0.07708 becomes the next demand area, and a failure there could send the price down to $0.07039, close to levels last seen in the June accumulation phase.
Traders watching this Pi Network price prediction should treat a support breakdown as a signal to reassess rather than assume an automatic bounce.
Support and Resistance Levels
Support
Resistance
$0.08318
$0.09183
$0.07708
$0.09883
$0.07039
$0.11087
Bull, Base, and Bear Scenarios
Scenario
Setup
Level
Bull
Reclaim the trendline, close above resistance with volume.
$0.09883–$0.11087
Base
Range-bound between immediate support and resistance
$0.08318–$0.09183
Bear
Confirmed breakdown below nearest support
$0.07708–$0.07039
Pi Network vs Bitcoin
$PI's recent drop lines up with a broader pullback across the wider crypto market, where Bitcoin price today has also cooled off from its recent highs.
$PI Network tends to amplify Bitcoin's directional moves rather than move independently, which is common for smaller-cap altcoins still building out their exchange liquidity and trading history.
A stabilizing Bitcoin market would likely support any recovery attempt in $PI, while renewed Bitcoin weakness could deepen the current pullback.
Expert Opinion
Market analysts covering small and mid-cap altcoins generally view sharp double-digit drops like $PI's recent move as a test of trader conviction rather than an automatic trend reversal.
The combination of a trendline break alongside a live protocol upgrade adds an unusual layer to this setup, since network fundamentals and short-term technicals are moving through a transition period at the same time.
Disclaimer: This article is for informational purposes only and does not constitute financial advice. Cryptocurrency markets are highly volatile, and prices can move sharply in either direction. Support and resistance levels discussed here are technical estimates, not guarantees, and actual price movement may differ significantly. Readers should conduct their own research before making investment decisions.