The team says current pricing has been heavily subsidizing AI costs, and the shift aims to push creators toward apps with real users instead of test builds. This Pi Network Price Prediction l
The team says current pricing has been heavily subsidizing AI costs, and the shift aims to push creators toward apps with real users instead of test builds.
This Pi Network Price Prediction looks at whether the announcement changes the setup for PI holders or whether the chart is telling a different story entirely.
Market data was checked on August 19, 2026, at 10:40 IST.
Pi Network Price Prediction Today: Price Analysis
Metric
Value
Price
$0.08632
24h Change
+0.25%
Market Cap
$954.25M
FDV
$8.63B
24h Volume
$5.72M
Vol/Mkt Cap (24h)
0.5993%
Total Supply
100B PI
Max Supply
100B $PI
Circulating Supply
11.05B $PI
Source: Data from CoinMarketCap as of August 19, 2026, at 10:40 IST. Figures may vary slightly across other tracking websites.
Pi Network News: App Studio Pricing Update
Per a BSCNews post, Pi Network will change App Studio pricing from August 24, 2026. Creators currently pay 0.25 $PI to create or edit an app, and the team says this heavily subsidizes AI service costs. 
New pricing will reflect the actual resources each app uses, though apps that attract real users can still get subsidized rates.
Apps used mainly for testing or experimentation may see higher costs going forward, with the stated goal of pushing creators toward building genuinely useful applications.
Pi says pricing will keep evolving as more usage data comes in.
Pi Network Price Prediction: Chart Signals Next Big Move
Pair: $PI/USDT · Market: Spot (Crypto) · Exchange: OKX · Timeframe: 4H · Source: TradingView · Timestamp: August 19, 2026, 10:40 UTC+5:30
PI is trading at $0.08640, consolidating inside a rising channel, and a trendline was developed from the July 29 low.
Price rallied sharply off that trendline into early August, tapped resistance near $0.09395, and has since pulled back into a tighter range.
The EMA (Exponential Moving Average) cluster sits just above price, with the 20-period EMA at $0.08692 and the 50-period EMA at $0.08742, both acting as immediate resistance that still needs to clear.
$PI's RSI sits at 43.96, in neutral territory but leaning below the midpoint.
It's not signaling oversold or overbought conditions, just a market waiting for a trigger.
If the price continues to decline and breaks below the current support, be prepared for further downside.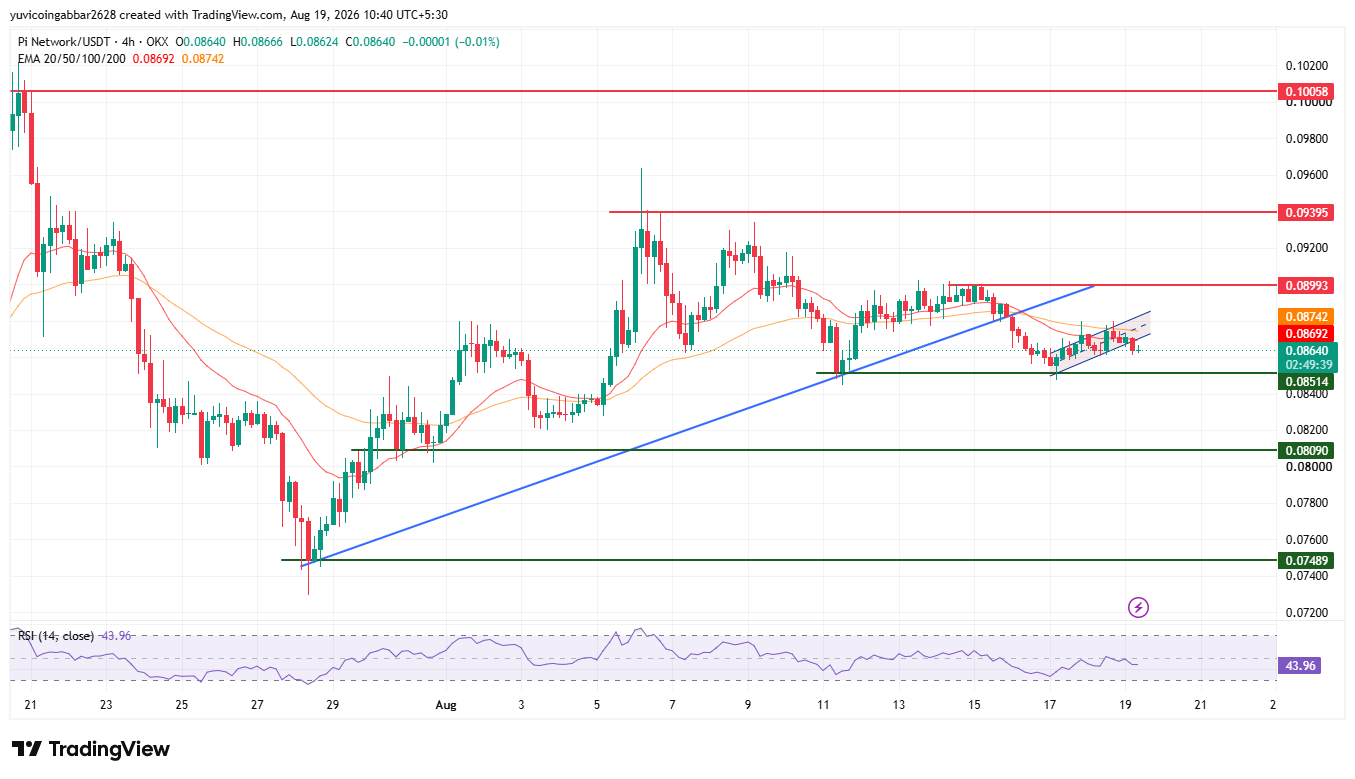
Pi Network Key Price Levels to Watch
Level Type
Price
Resistance 3
$0.10058
Resistance 2
$0.09395
Resistance 1 (nearest)
$0.08993
Immediate Price Reference
$0.08640
First Support
$0.08514
Deeper Support
$0.08090
Structural Floor
$0.07489
Pi Network EMA Levels: Rally or Further Downside?
EMA
Price
EMA 20
$0.08692
EMA 50
$0.08742
Pi Network Forecast: Bull Case vs Bear Case
$PI price target 2026 Bull case: Holding the price above $0.08514 support and clearing the EMA cluster at $0.08692 to $0.08742 would confirm the channel is still intact.
A confirmed move above $0.08993 would open the path toward $0.09395 and eventually $0.10058.
$PI price target 2026 Bear case: A break below $0.08514 would put the ascending channel in doubt and risk a slide back toward $0.08090.
Losing that level would expose the $0.07489 structural floor.
$PI Price Scenarios: Triggers and Invalidation
Scenario
Trigger
Likely Outcome
Invalidation Point
Channel hold / bullish
Clear EMA cluster near $0.08692–$0.08742
Move toward $0.08993, then $0.09395 & $0.10058
Next $0.08993
Range consolidation
Price stays between $0.08514 and $0.08993
Sideways chop before the next move
Break of either boundary
Channel breakdown / bearish
Close below $0.08514
Slide toward $0.08090 & $0.07489
Reclaim of $0.08514
$PI price target: Can $PI Reach $0.10058?
$0.10058 is the highest resistance level marked on the chart.
Reaching it would require $PI to first clear the EMA cluster near $0.08692 to $0.08742 and the nearest resistance at $0.08993, then break and hold above $0.09395 a multi-stage move rather than a single leg from current levels.
What Could Invalidate the Bullish Setup?
A rejection at the EMA cluster and nearest resistance near $0.08993 followed by a close back below $0.08514 would put the channel structure in question.
A deeper break below $0.08090 would expose the $0.07489 structural floor.
$Pi Network Price Prediction: Expert View
According to CoinGabbar analysts, PI's price action has been fairly contained since the early-August rally faded, with the ascending channel from the July 29 low still technically intact.
The App Studio pricing news is more of a platform-usage story than a direct price catalyst, but it signals $Pi's team is actively shaping creator incentives, which can matter for longer-term ecosystem activity.
RSI at 43.96 shows no strong directional bias right now.
The $0.08514 to $0.08993 range is the zone to watch holding it keeps the channel thesis alive, while losing $0.08514 would shift the picture toward consolidation risk.
Disclaimer: This piece is for informational purposes only and isn't financial advice. The levels and scenarios above are based on technical chart analysis and publicly available data at the time of writing, and crypto markets can move sharply within hours, so past patterns don't guarantee future outcomes. It's worth doing independent research and considering your own risk tolerance before acting on any of the levels discussed here.