A post says Pi Network has released Pi Desktop 0.6.4. Can the update lift PI? Not by itself. It is a software change, and the daily chart shows PI trading under its sideways range and under a
A post says Pi Network has released Pi Desktop 0.6.4. Can the update lift PI? Not by itself. It is a software change, and the daily chart shows PI trading under its sideways range and under all four EMAs.
This Pi Network Price Prediction November 2026 explains what the chart shows, then lists the levels that matter next.
Market data checked on October 27, 2026, at 12:14 IST.
PI Price Prediction Today: Market Overview
Metric
Value
Current Price
$0.07617
Daily Candle Change
+0.55%
Candle Open
$0.07686
Candle Range
$0.07533 – $0.07695
Pi Network News Today: Pi Desktop 0.6.4 Released
The Pi Core Team has released Pi Desktop 0.6.4. The post says the update removes the router setup that was needed for remote SoloHost access. It also says the update adds checks that limit what apps can reach on a user's computer.
CoinGabbar could not verify the release. Even if it is accurate, it is a software fix and shows no change in demand for PI.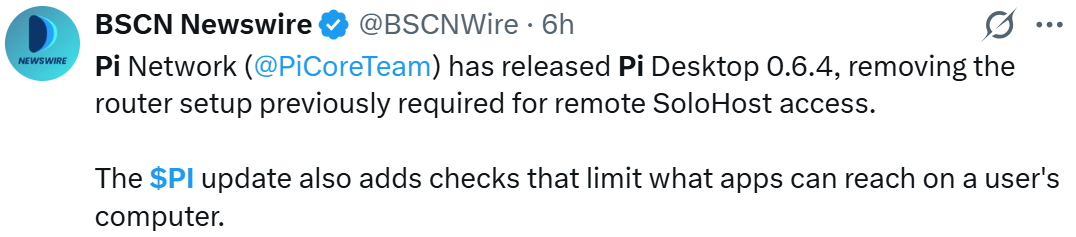
Source: Data From X
Pi Network Price Prediction: Chart Analysis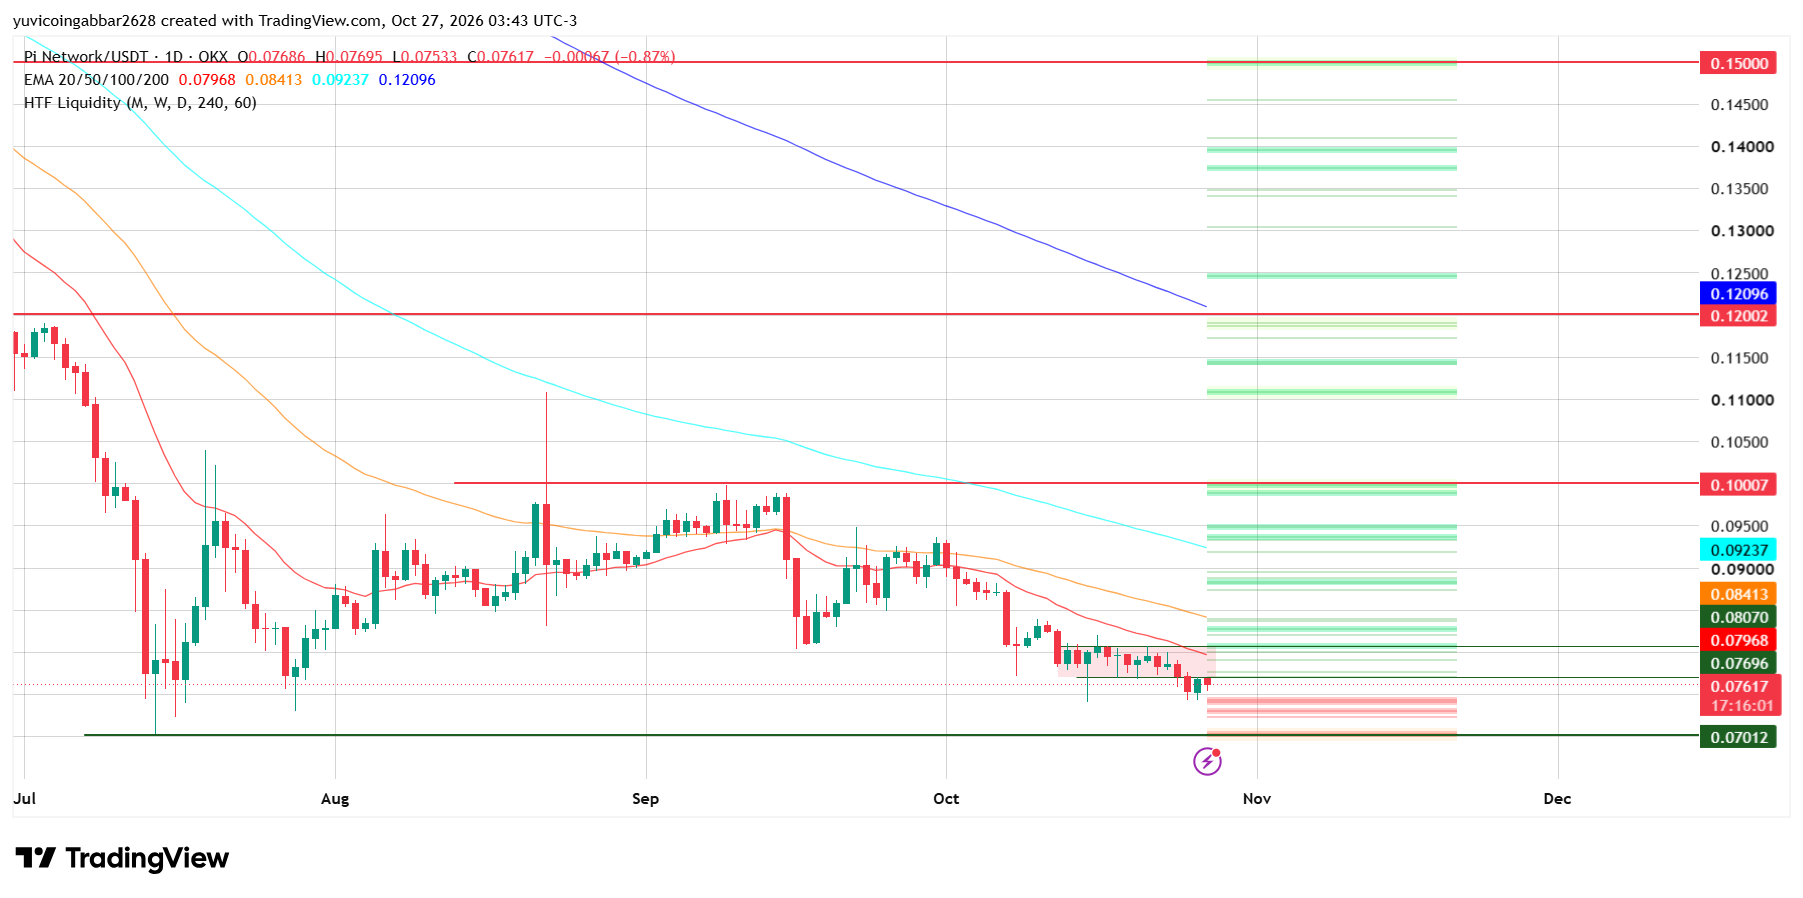
PI fell from near $0.12 in early July to about $0.07 by mid-July. It then moved sideways. After that, the price slid back down.
Consolidation means the price moves sideways in a tight range while traders wait for a direction. From mid-October, PI held between $0.07696 and $0.08070, the shaded zone on the chart.
The price has now dropped under the range floor. Today's candle opened at $0.07686, ranged from $0.07533 to $0.07695 and printed $0.07617.
That is about 1.3% above the $0.07519 reading on October 26, so the drop paused but did not reverse.
the 20 EMA is about 4.6% higher. They are also stacked in order. That is a bearish setup, and PI has stayed under the 20 EMA throughout the consolidation.
EMA
Value
Position vs Price
EMA 20 (red)
$0.07968
Above price, about 4.6%
EMA 50 (orange)
$0.08413
Above price, about 10.5%
EMA 100 (cyan)
$0.09237
Above price, about 21.3%
EMA 200 (blue)
$0.12096
Above price, about 58.8%
Pi Network Forecast: Support and Resistance Levels
Type
Level
Highest marked level
$0.15000
Higher resistance
$0.12002
Resistance 2
$0.10007
Resistance 1
$0.08070
Range floor (now overhead)
$0.07696
Support
$0.07012
Bull case: A daily close back above $0.07696 would return $PI to its range. A close over the 20 EMA at $0.07968 and then $0.08070 would test the 50 EMA at $0.08413.
Bear case: If $PI closes below $0.07012, the July low would fail. The chart marks no level under it, so the price would be in untested territory.
PI Scenarios and Invalidation (October 27, 2026)
Scenario
Trigger
Likely Outcome
Invalidation
Bull
Close above $0.08070
Move toward $0.08413, then $0.09237
Close below $0.07696
Base
Range of $0.07012 to $0.07696
Sideways under the old floor
Break of either level
Bear
Close below $0.07012
Fresh lows with no marked support
Close back above $0.07012
Pi Network Price Prediction November 2026: Can Pi Reach $0.10007?
It would take a gain of about 31% from $0.07617. Any PI price prediction toward that level needs more than a software update, since $PI must reclaim $0.07696, clear $0.08070 and pass the 50 and 100 EMAs first. The $0.15000 mark would mean a gain of about 97%.
Pi Network Price Prediction: Expert View
Price sits under its range floor and all four EMAs, so a daily close back above $0.07696 would be the first sign of relief, and a close below $0.07012 the next sign of weakness.
Disclaimer
This article is for informational purposes only and isn't financial advice. Crypto markets are volatile. Always do your own research before making any trading decisions involving PI.