The Pi Network price prediction October 2026 debate starts with a number that sits just out of reach. $PI trades at $0.08876 with a market cap of $997.976M, about $2M short of $1 billion, whi
The Pi Network price prediction October 2026 debate starts with a number that sits just out of reach.
$PI trades at $0.08876 with a market cap of $997.976M, about $2M short of $1 billion, while a new BSCN explainer turns attention to lock-up periods.
Pi Network was started in 2019 by Stanford graduates Dr. Nicolas Kokkalis and Dr. Chengdiao Fan as a mobile-first crypto project. Its open mainnet went live in February 2025.
For the latestPi coin price today, the Pi coin trades at $0.08876, down 1.5% over 24 hours. It ranks #80 by market cap at $997.976M, and its 24-hour range runs from $0.08611 to $0.09129.
Pi Network Coin Live Data
Metric
Value
Price
$0.08876
24h Change
-1.5%
24h Range
$0.08611 - $0.09129
Market Cap
$997.976M
Market Cap Rank
#80
Source: market data taken from CoinGecko, as of Oct 3, 2026. Figures may vary slightly across other tracking websites.
The market cap sits about $2M, or 0.2%, below the $1 billion mark. A small price rise would cross it, but the level is a round-number marker, not a technical barrier.
Pi Network (PI) News Today
The latestPi Network news is a BSCN explainer on Pi's lock-up periods and how they affect circulating supply.
In general, a lock-up stops tokens from being sold or moved for a set time, so it reduces the supply that can reach the market. When a lock-up ends, that supply can grow.
Source:Data taken from @BSCNews, X Account, as of Oct 3, 2026
The post gives no unlock dates, token amounts, or price impact. It explains the concept without offering a trigger for this week.
At the current price and market cap, circulating supply works out to about 11.24 billion $PI, so any change in lock-ups would be measured against that base.
Pi Network Technical Analysis
ThisPi Network technical analysis uses the 4-hour (4H) PIUSDT chart on OKX, captured at 15:07 IST on October 3, 2026. The current 4H candle was still open at capture and closes at about 17:30 IST (12:00 UTC).
Price sits inside a symmetrical triangle. A falling trendline from the mid-September high presses down, a rising trendline from the September 20 low pushes up, and the two lines converge near October 11.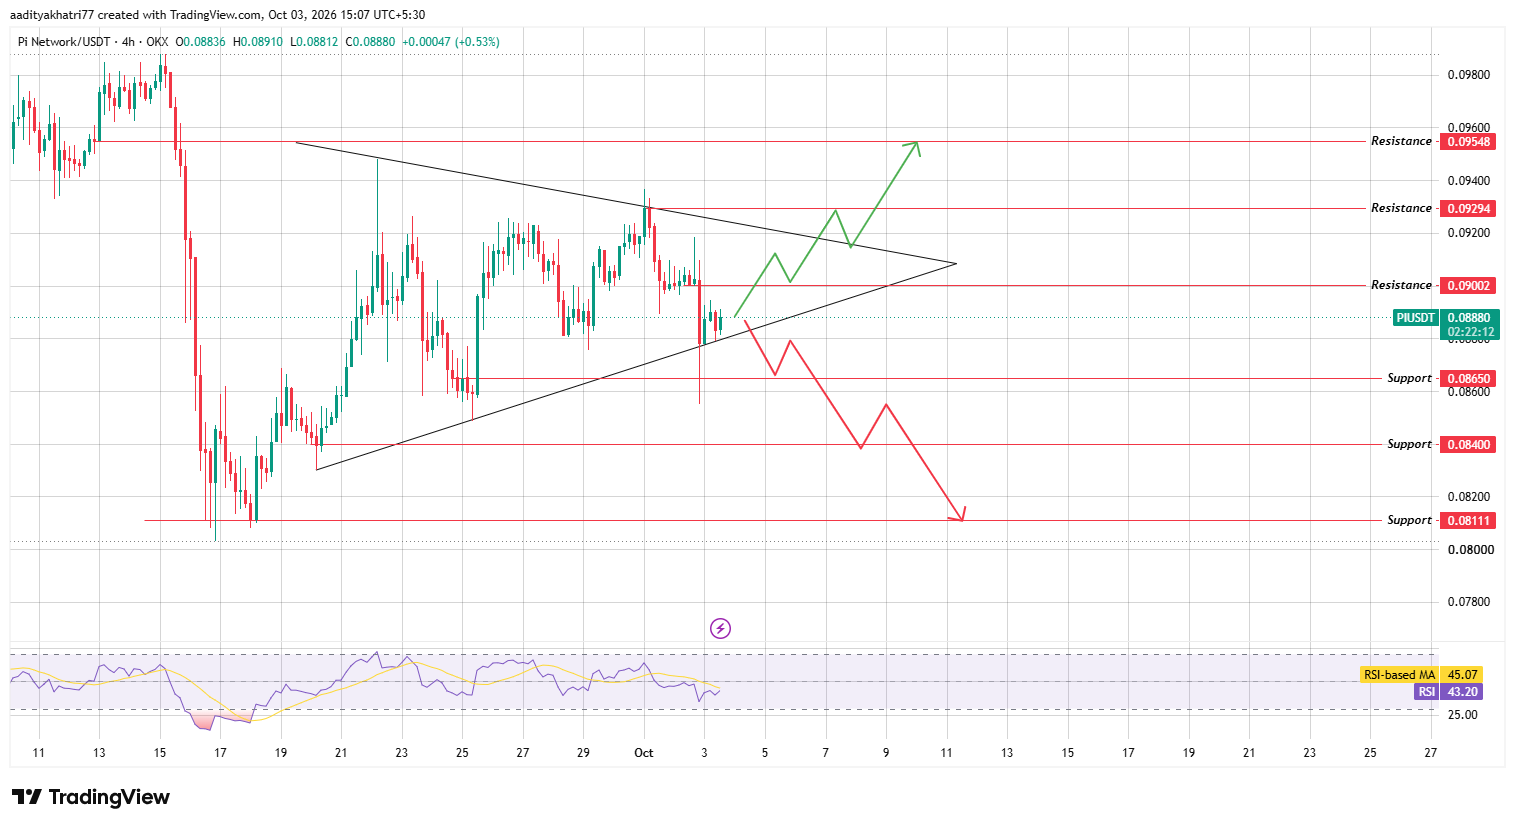
Source: Chart taken from TradingView, OKX PIUSDT, October 3, 2026
A long red candle on October 2 to 3 briefly dipped under the rising trendline and the $0.08650 support before the price recovered.
The CoinGecko 24-hour low of $0.08611 confirms that brief move. At capture, the price sat at $0.08880, just above the rising trendline, which is the first line to watch.
The RSI reads 43.20 and sits below its moving average at 45.07. That points to soft momentum and a cautious lean, though neither reading is at an extreme.
Can $PI Network Push Toward Higher Resistance?
Thebullish case starts with a bounce from the rising trendline. $PI then has to clear the $0.09002 resistance, about 1.4% above the current price.
The next barrier is the falling trendline, which runs close to the $0.09294 resistance, about 4.7% higher.
A real breakout needs a 4H candle close above both, with volume at least 1.5 times the average of the previous 20 candles. A close on weaker volume would leave the move open to a fade.
If that happens, the next stop is $0.09548, roughly 7.5% above the current price. Wicks above the trendline without a close do not count as a break.
What Happens If the $PI Network Breaks the Rising Trendline?
The weaker path begins if the price loses the rising trendline, which sits just under the current price. A 4H close below it on the same 1.5x volume threshold would confirm a breakdown of the triangle.
The first target is the $0.08650 support, about 2.6% lower. After that come $0.08400, near 5.4% below, and $0.08111, about 8.7% below the current price and close to the mid-September lows.
The soft RSI reading gives the setup a cautious lean until a trendline break proves otherwise.
Price Levels to Watch
Support
Resistance
$0.08650
$0.09002
$0.08400
$0.09294
$0.08111
$0.09548
Bull, Base, and Bear Scenarios
Scenario
Setup
Level
Bull
Bounce from the rising trendline, 4H close above $0.09002 and the falling trendline with rising volume
$0.09294, then $0.09548
Base
Price stays inside the triangle between the two trendlines.
$0.08650 - $0.09002
Bear
4H close below the rising trendline with rising volume
$0.08650, then $0.08400 and $0.08111
Pi Network vs Bitcoin
Over 24 hours, $PI slipped 1.5% in dollar terms but gained 0.4% against Bitcoin. That implies Bitcoin fell by roughly 1.9%, so PI held up slightly better than the market leader.
That relative strength is small, and it can reverse quickly. A Bitcoin rebound could help $PI test the falling trendline, while a deeperBitcoin price drop would likely test the rising trendline first.
Methodology
ThisPi Network price forecast relies on three sources. Price levels, both the trendlines and the RSI, come from the OKX $PIUSDT 4H chart on TradingView.
Market data comes from CoinGecko, and the news item comes from a public X post by BSCN.
Every level is tied to 4H candles, so a signal counts only after a full candle close. Percentage moves in this Pi Network price prediction are measured from the chart price of $0.08880.
The 11.24 billion circulating supply figure is derived from market cap and price, not read from a supply page.
Expert Opinion
General market commentary on $PI often centers on circulating supply, because lock-up schedules decide how many coins can be sold.
A clear unlock calendar would make that debate easier, but the BSCN post does not provide one.
On this chart, the decision point is the triangle. Its lines meet near October 11, which falls just before the Protocol 28 dates covered in recent CoinGabbar reports, with the node upgrade deadline on October 13 and mainnet on October 16.
For readers following the Pi coin, a close outside either trendline will matter more than any single headline. The latestPi coin coverage tracks the same triangle setup.
Disclaimer:This article is for information only and is not financial advice. Crypto prices are volatile, and lock-up news does not guarantee a price move. $PI can fall below every support level named here, and a failed breakout can reverse quickly. No scenario is guaranteed, and readers should research independently and invest only what they can afford to lose.