PI has had a rough few days, down over 3% today, but the bigger picture still looks steady. Price keeps climbing in small steps rather than falling apart, which is usually a good sign. If buy
PI has had a rough few days, down over 3% today, but the bigger picture still looks steady.
Price keeps climbing in small steps rather than falling apart, which is usually a good sign.
If buyers push the price higher from here, this Pi Network price prediction favors a move toward $0.10 and above.
If sellers take over instead, the price could slip back toward $0.08 first.
Live Market Data
PI is trading at $0.0881, down 3.5% over the last 24 hours. The price moved between $0.08712 and $0.09376 in that time. 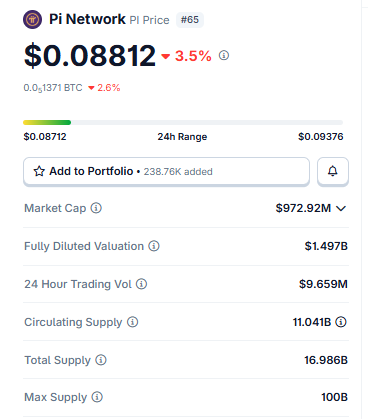
Source: $PI Market Cap Data Taken From Coingecko, data as of Aug 07, 2026. Figures may vary slightly across other tracking websites.
Market cap sits at $972.92M, with a fully diluted value at $1.497B. Circulating supply is 11.041B out of a total supply of 16.986B and a much bigger max supply of 100B, so plenty of PI is still not in circulation yet.
24-hour trading volume came to $9.659M.
Social Sentiment of $PI Network
Some analysts following Pi Network are focused less on price swings and more on what's being built. 
Source: Data Taken From @Whale_WatcherB, X Account.
One widely shared post highlights Pi's new decentralized exchange as a real step toward Web3, arguing that Pi keeps developing quietly while other coins chase headlines.
If that utility story keeps growing, it could give this Pi Network price prediction more long-term support.
$PI trades near $0.0881, down 3.5% today, still moving inside a steady upward channel on the 4H chart.
Break above the channel, and $PI could push to $0.1007, then $0.1123.
On the daily chart, $PI sits inside a tightening pattern that could send the price to $0.1036 or even $0.1192 if buyers step in.
Break down instead, and $0.0806 comes first, with $0.0748 below that.
Whale-focused accounts are pointing to $Pi's new DEX as a long-term growth driver.
Technical Analysis of $PI Network
4H Chart: Rising Channel
On the 4H chart, PI has been moving up inside an ascending channel, basically a set of two lines going up together, one under the price and one above it. 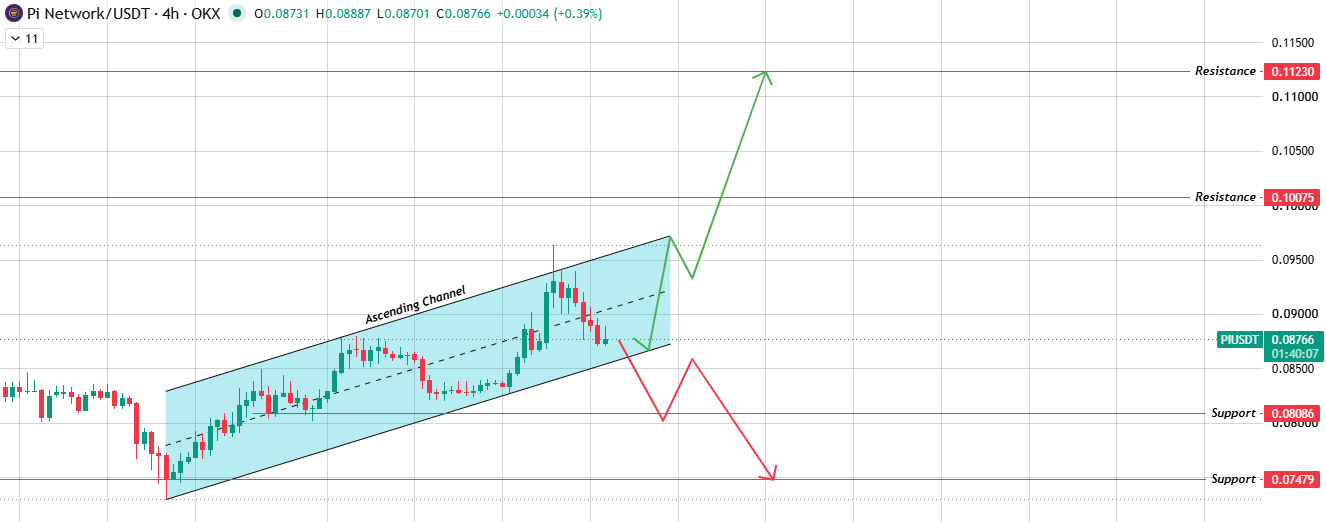
Source: Chart Taken From TradingView.
Right now the price sits near the middle.
If $PI breaks above the top of this channel, the next stop is $0.1007, and then $0.1123 if the move keeps going.
If the price instead breaks below the bottom of the channel, expect a drop toward $0.0806 and possibly $0.0748 after that.
1D Chart: Triangle and Wolfe Wave
Zoom out to the daily chart, and the $PI looks squeezed inside a symmetrical triangle, a pattern where price moves keep getting smaller until something breaks. 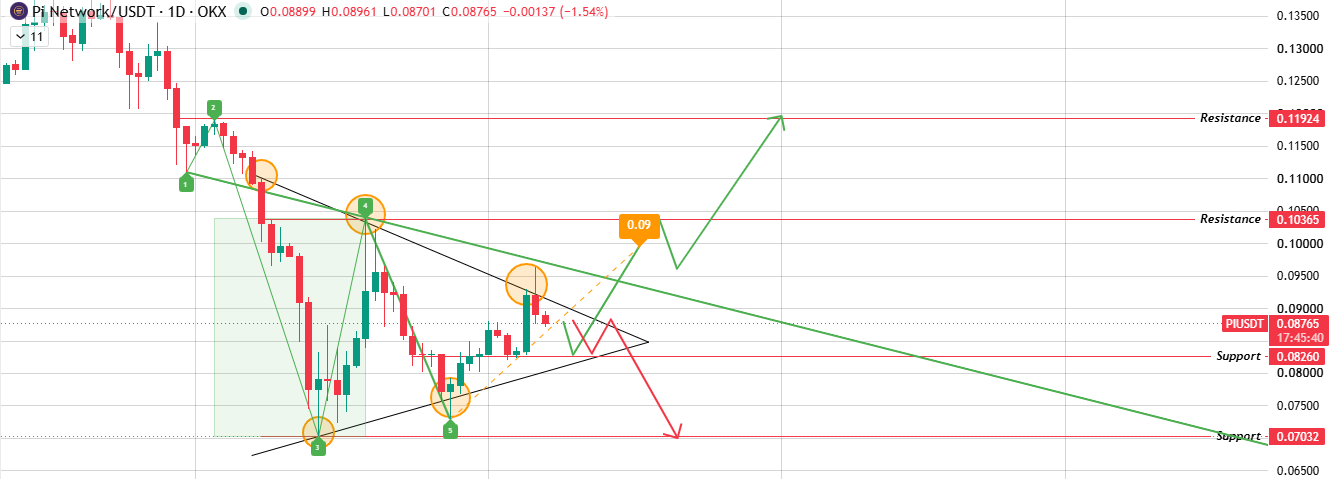
Source: Chart Taken From TradingView.
There's also a Wolfe Wave setup, a five-point pattern traders use to guess where price might head after a breakout, and it lines up with the same upside direction here.
If PI breaks above the triangle with strong volume, the Wolfe Wave points toward $0.1036 first and $0.1192 further out.
If price instead breaks below the triangle's rising support line, $0.0826 becomes the next support, with $0.0703 as a deeper level if selling picks up.
Bull, Base, and Bear Scenarios
ScenarioTriggerLevel 1Level 2BullBreak the above channel and triangle resistance.$0.1007 / $0.1036$0.1123 / $0.1192BasePrice stays inside the channel.$0.085-$0.090Range-boundBearBreak below the channel and triangle support.$0.0806 / $0.0826$0.0748 / $0.0703
Risks
PI doesn't trade alone; it moves with the rest of the market too.
Let BTC dominance shift hard enough, and PI could get dragged along regardless of what its own chart says.
Triangles and channels look clean on paper, but they fail more often than people expect.
Better to wait for an actual breakout with real volume behind it than jump the gun on the first move.
Glossary
Ascending Channel:Two rising lines running side by side, price bouncing between them, a simple way to spot a steady uptrend.
Symmetrical Triangle: Price swings get tighter and tighter here until something finally gives, usually leading to a sharp move.
Wolfe Wave: Traders spot five specific swing points and use them to guess roughly where price lands after the next breakout.
Methodology:Levels in this Pi Network price prediction come directly from TradingView chart analysis on the 4H and 1D timeframes, along with market data collected at the time of writing. Figures can change as the market moves.
Disclaimer: This article is for informational purposes only and does not constitute financial advice. Cryptocurrency markets are highly volatile and speculative. Always do independent research and speak with a licensed financial advisor before making investment decisions.